Over the past decade, high-resolution and high-sensitivity single-EV sequencing techniques have been developed. These track and profile vesicles via size, scattering, or antibody-based methods, analyzing proteomics, transcriptomics, and more. Key methods include Nanoscale Flow Cytometry, Proximity Barcoding Assays (PBA), Nanoparticle Tracking Analysis (NTA), and Stochastic Optical Reconstruction Microscopy (STORM).
We summarize their characteristics and parameters, and provide relevant publications to assist researchers in selecting methods based on their preferences. Additionally, we offer a comprehensive review of all analysis methods from 2015 to 2025 on the "technical diagram" page. Clicking on any method in the tree diagram will reveal its detailed information.
-
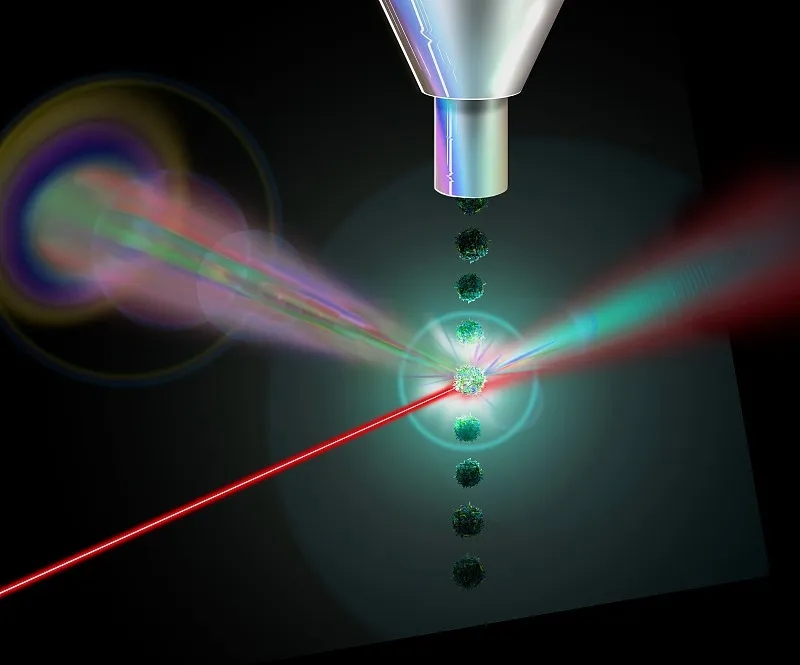
FCM
Flow cytometry (FCM) produces forward scattered light and lateral scattered light. The fluorescence signals at different wavelengths represent the abundance of biomarkers and the concentration of vesicle contents.
Apogee A50 and NanoFCM have been commercially used. Due to their advantages, including high sensitivity and resolution, as well as the absence of limitations related to particle shape regularity, these high-throughput and multi-parameter nanoscale flow cytometry techniques enhance the precision and efficiency of single exosome research. -
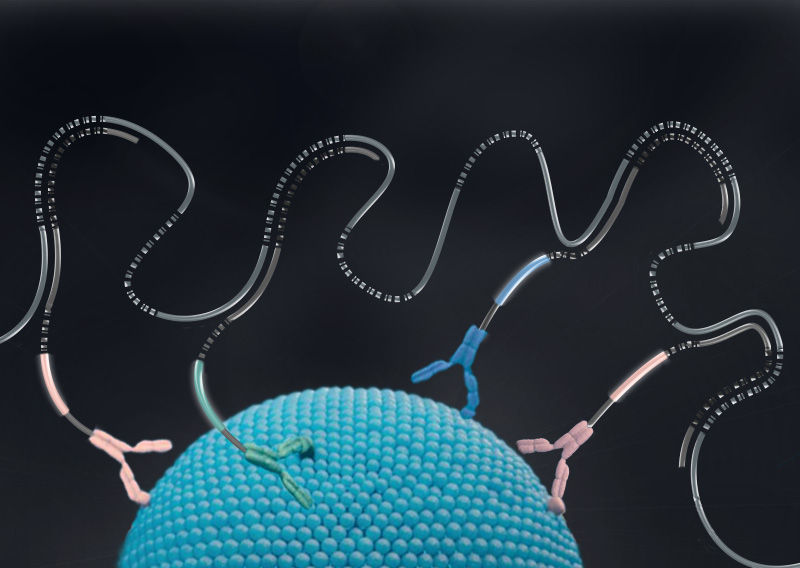
PBA
PBA is a high-throughput, commercially available single-EV analysis technique that can simultaneously analyze over 200 biomarkers on a single EV, revealing EV proteomic characteristics.
In PBA, the same EVs are bound together by hybridizing PBA probes with RCA products. The extended products on the PBA probes are amplified by PCR, and DNA sequences are used to record the combination of EV tags and protein tags.
Currently, the commercial system Secretech achieves high-precision and high-sensitivity study of exosomal heterogeneity.
-
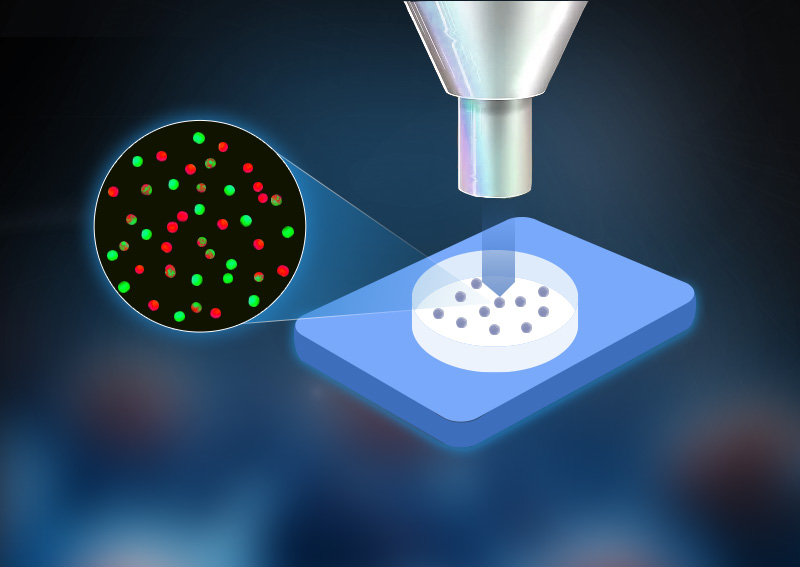
Imaging
Single EV analysis by fluorescence microscopy is utilized to reveal their architecture, enabling highly specific polychromatic labeling and live-cell tracking. A commonly used method is 'single molecule localization', which reconstructs images in a grid-like manner.
The main systems include NanoView and Nanoimager. With their high sensitivity, they enable live cell imaging and direct observation of nano-bio interactions, opening new avenues for studying nano-cell interactions. -
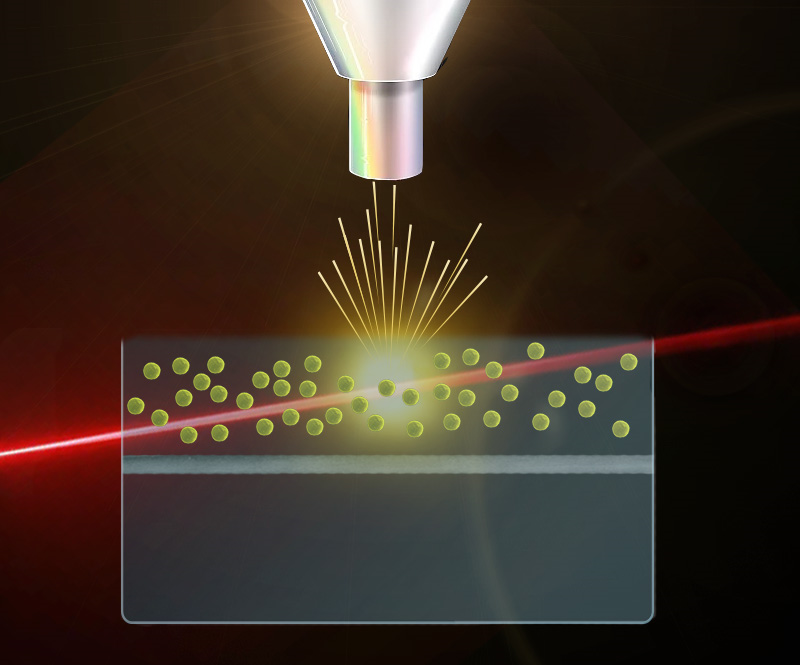
NTA
The technique detects particles through laser beam scattering, tracks and records the Brownian motion of each particle, and finally calculates the hydrodynamic diameter of each particle using the Stokes-Einstein equation.
NTA provides size distribution and concentration data of EVs in body fluids or purified samples. The technique has been optimized to detect EVs as small as 10nm. When combined with fluorescently labeled antibodies or molecular beacons, it can detect specific biomarkers. Current commercial systems include Malvern Panalytical and Particle Metrix.
Parameter comparison of the four main methods
| Technology | Nano-Flow Cytometry(nFCM) | Proximity Barcoding Assay(PBA) | Single exocrine imaging | Nanoparticle Tracking Analysis(NTA) | |||
|---|---|---|---|---|---|---|---|
| Exocrine purification | Required | NA | Required | NA | Required | ||
| Number of factors detected | Fluorescent labeling for 3 factors | DNA coding markers for >500 factors | Fluorescent labeling for 3 factors | Fluorescent labeling for 1 factors | |||
| Exosome particle size | >70nm | >40nm | Unrestricted | >50nm | >20nm | >10nm | |
| Amount of samples | 10 μL | 10 μL | 5 μL | 20 μL | 35 μL | 20 μL | |