Heterogeneity analysis
SVAtlas presents examples of single EV heterogeneity analysis using datasets stored in our database (project ID) . Two analysis types are performed based on sample source: tissue/organ heterogeneity (45 samples), and disease-specific heterogeneity (166 samples). Each includes (1) overall clustering, (2) selected highly heterogeneous subpopulations, and (3) differential expression heatmaps of marker combinations. The analysis integrates data from 96,047,791 EVs across 23 projects. Raw data, preprocessed JSON files from FlowSOM clustering, and visualization results are downloadable at the bottom of the page.
A "RE-ANALYSIS" button enables users to perform online heterogeneity analysis with advanced visualization features, with instructions in the "Help" section. SVAtlas will continuously update the data to enable more comprehensive single-extracellular vesicle analysis.
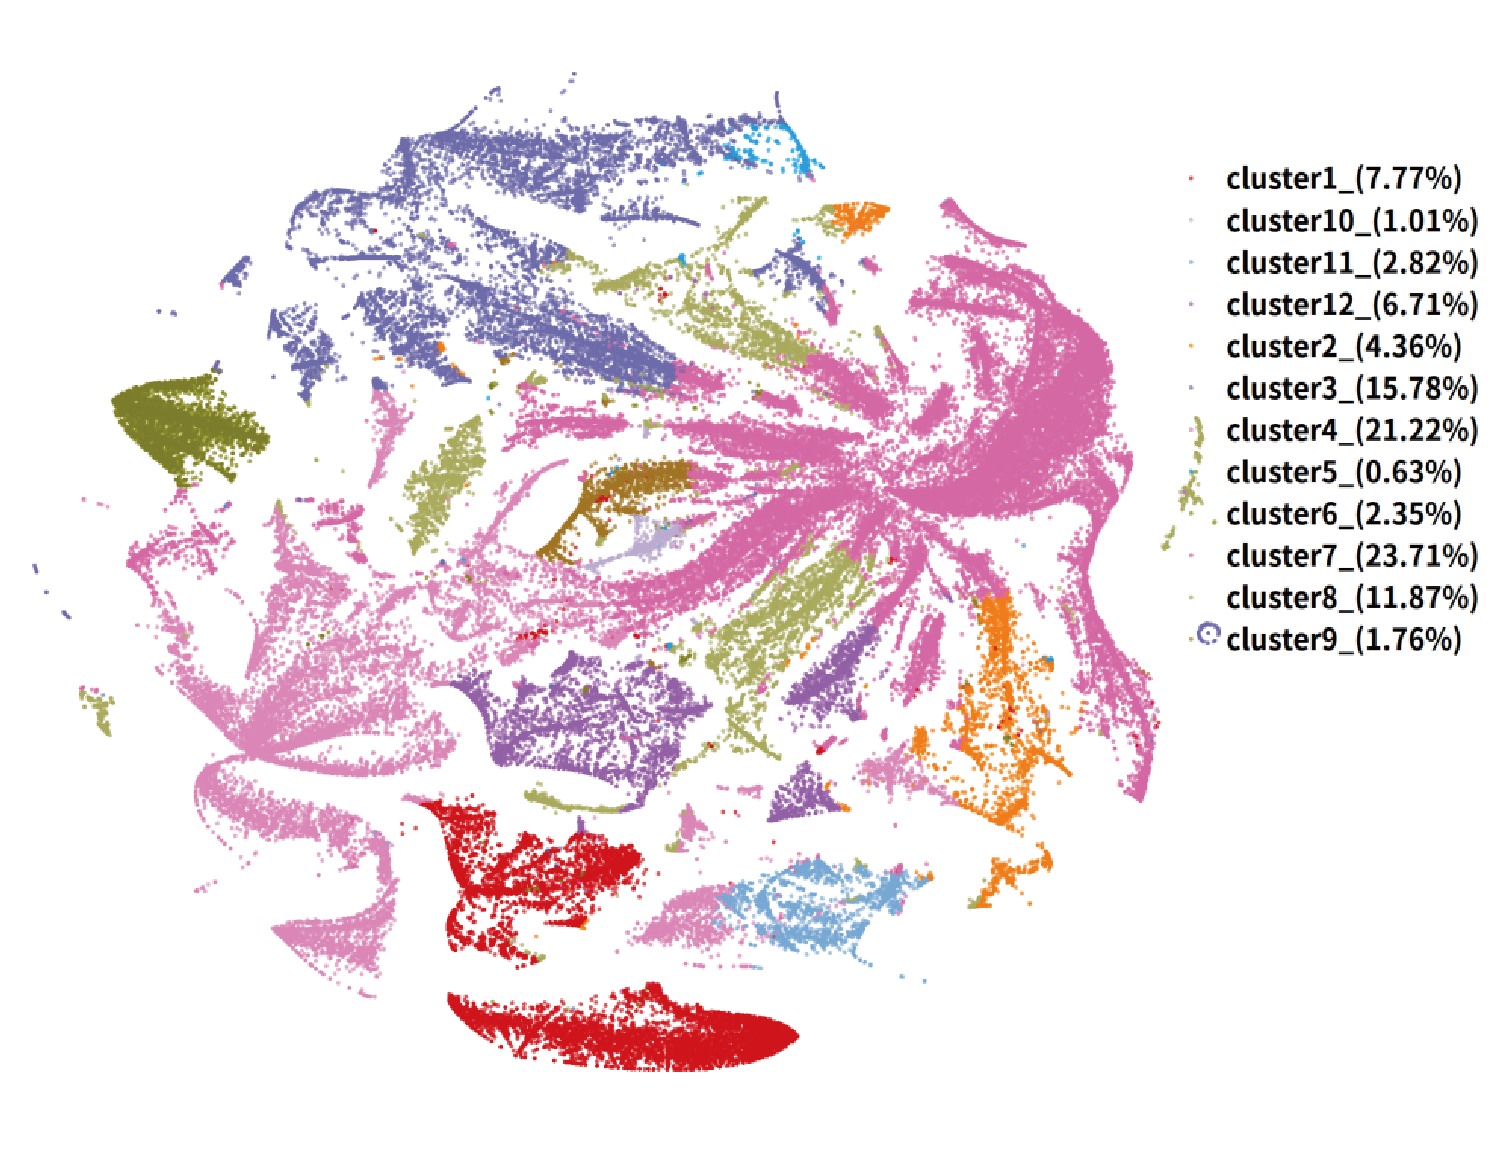
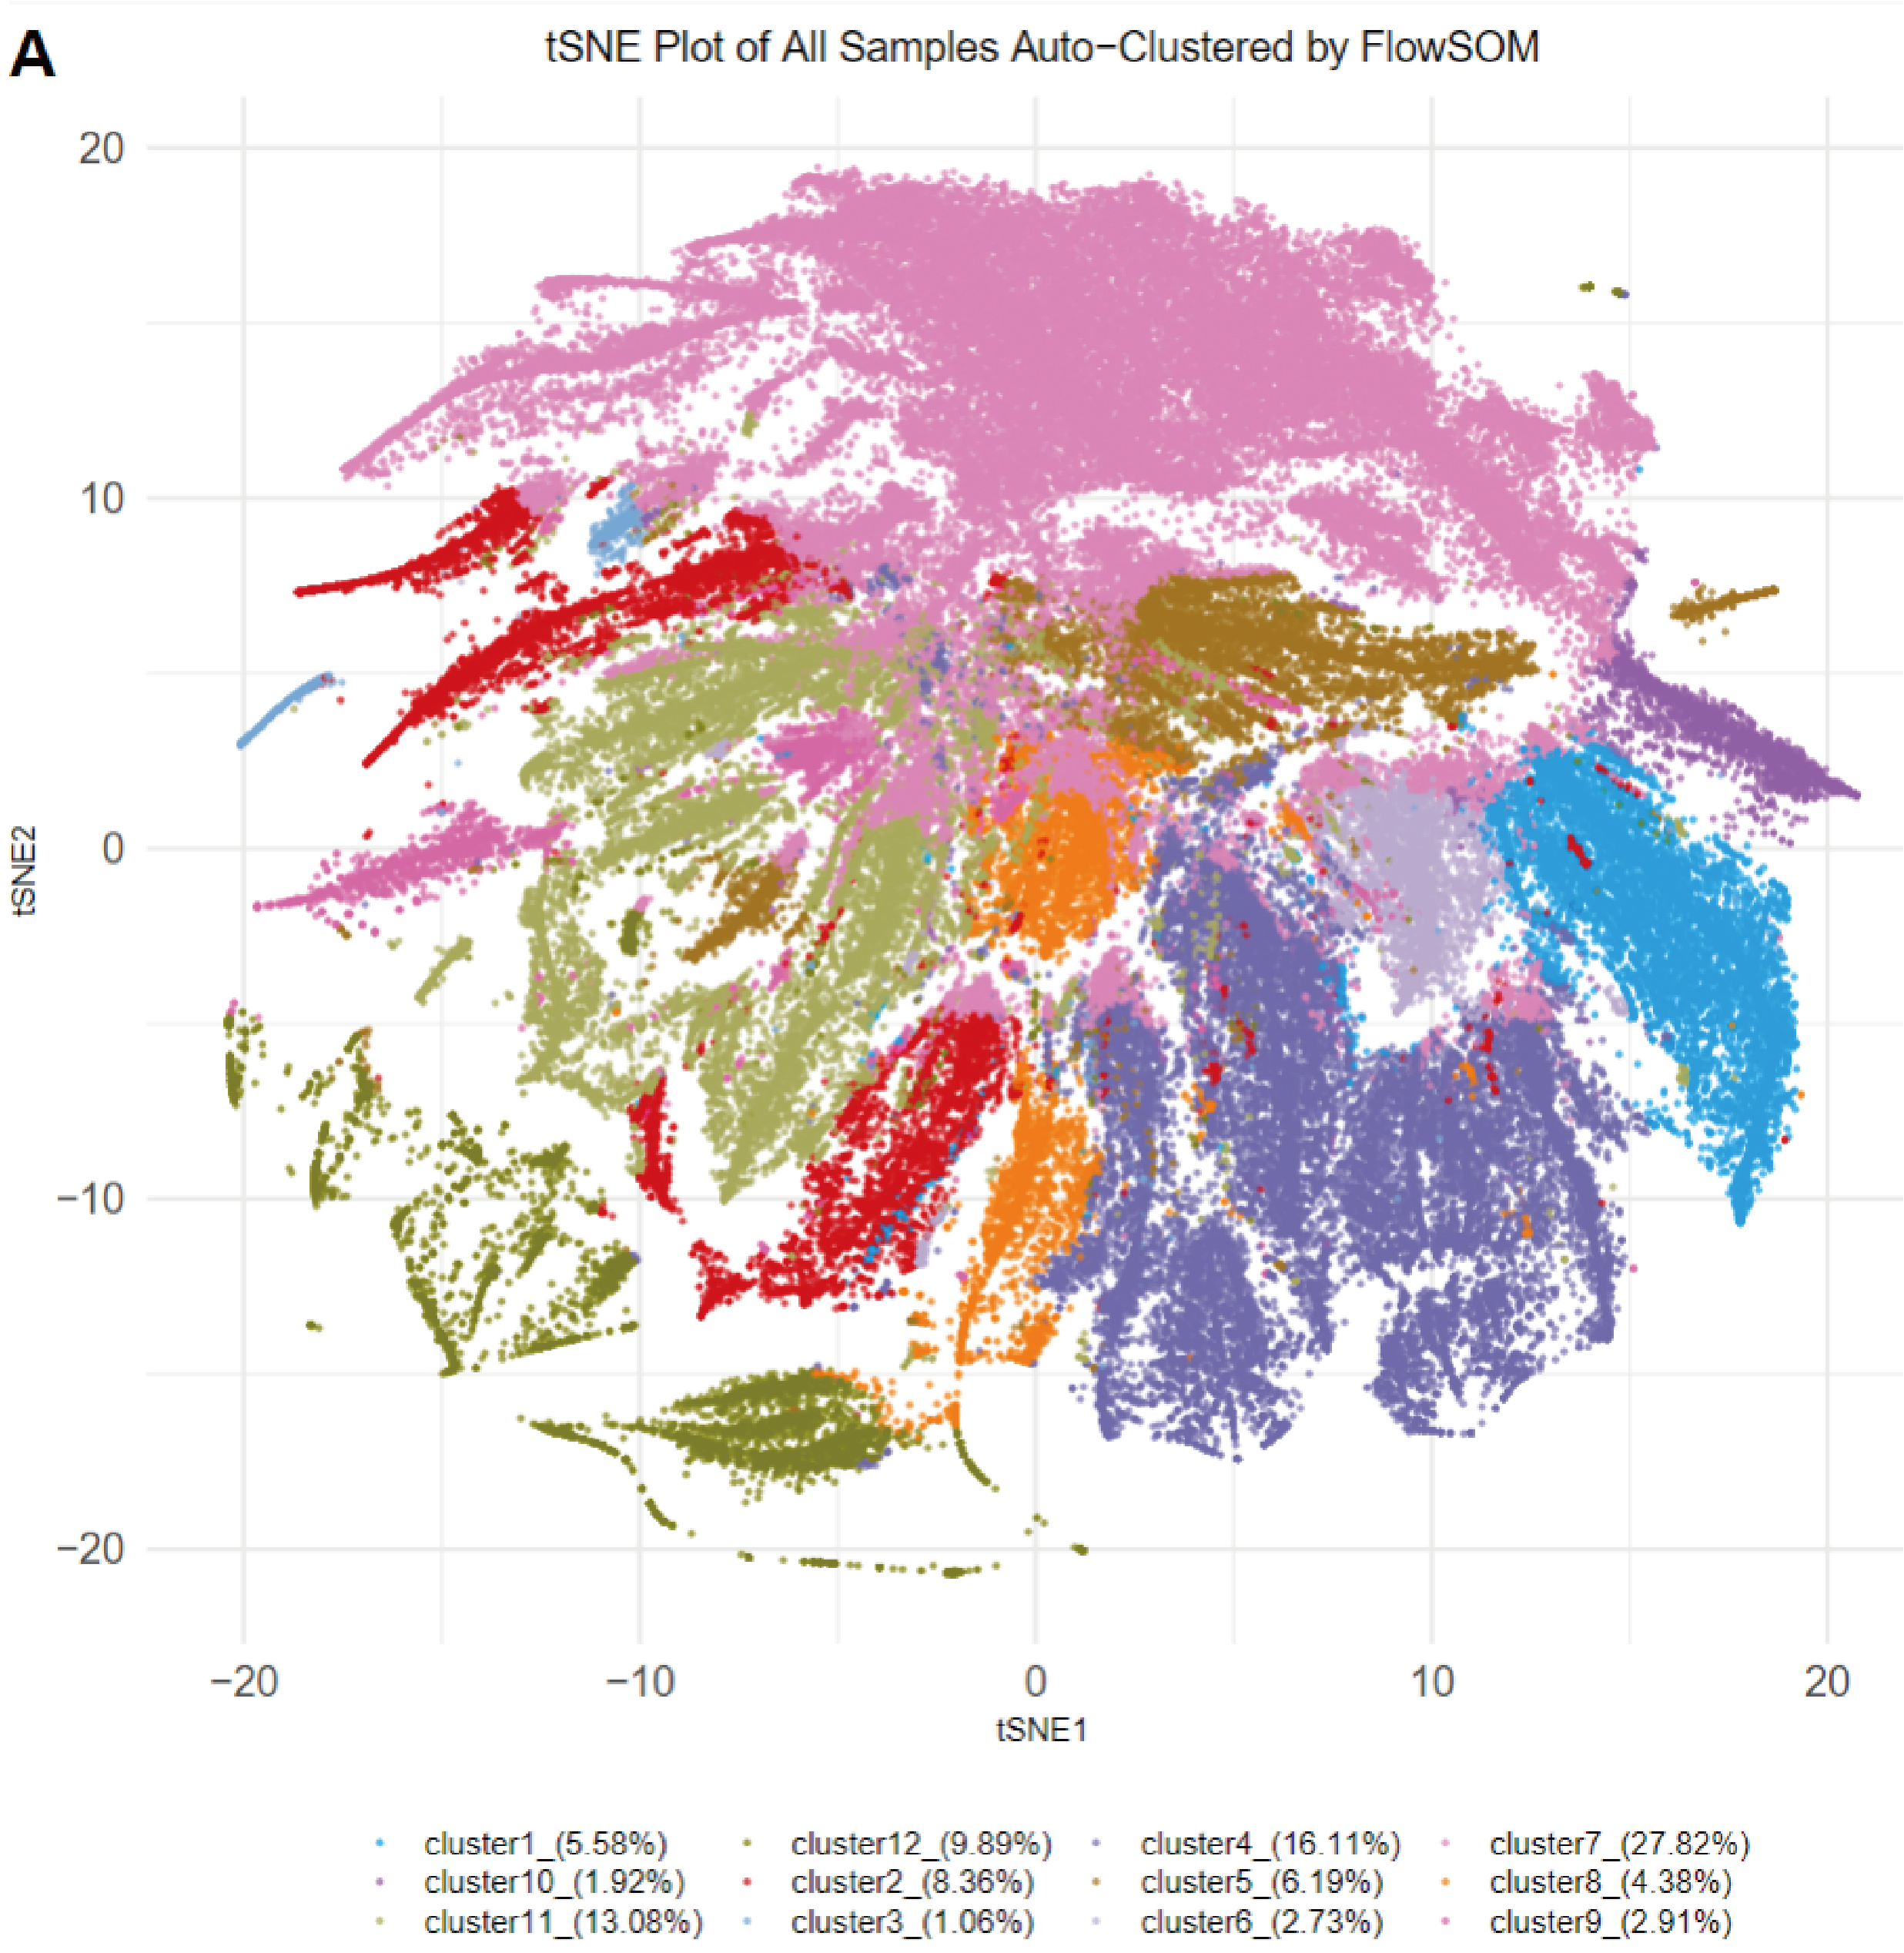
(1) Overall clustering across all samples
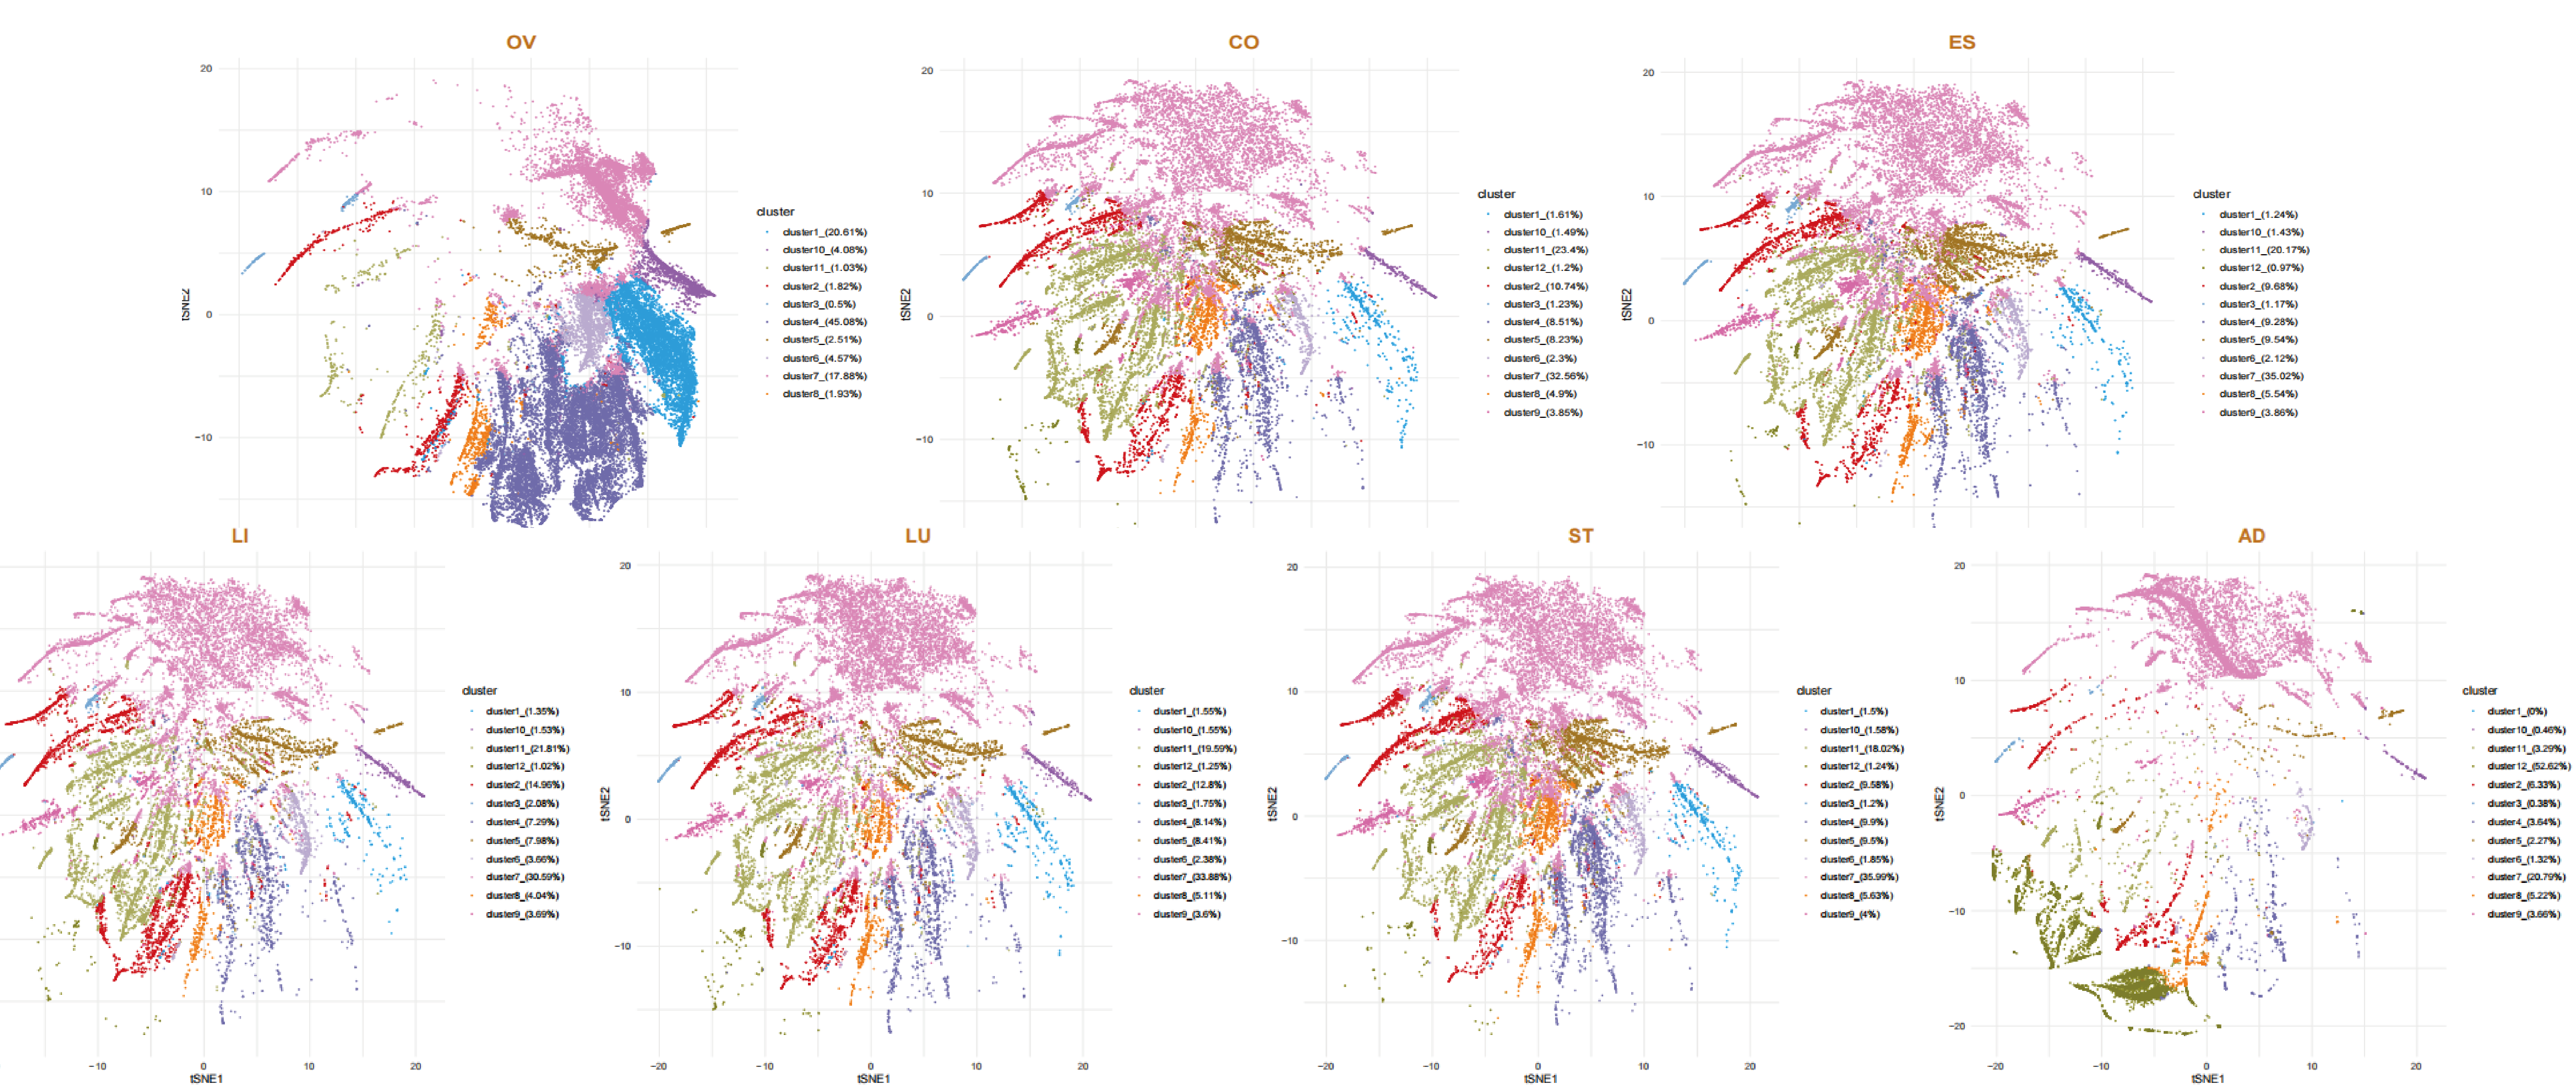
(2) Summary of clustering outcomes stratified by sample group
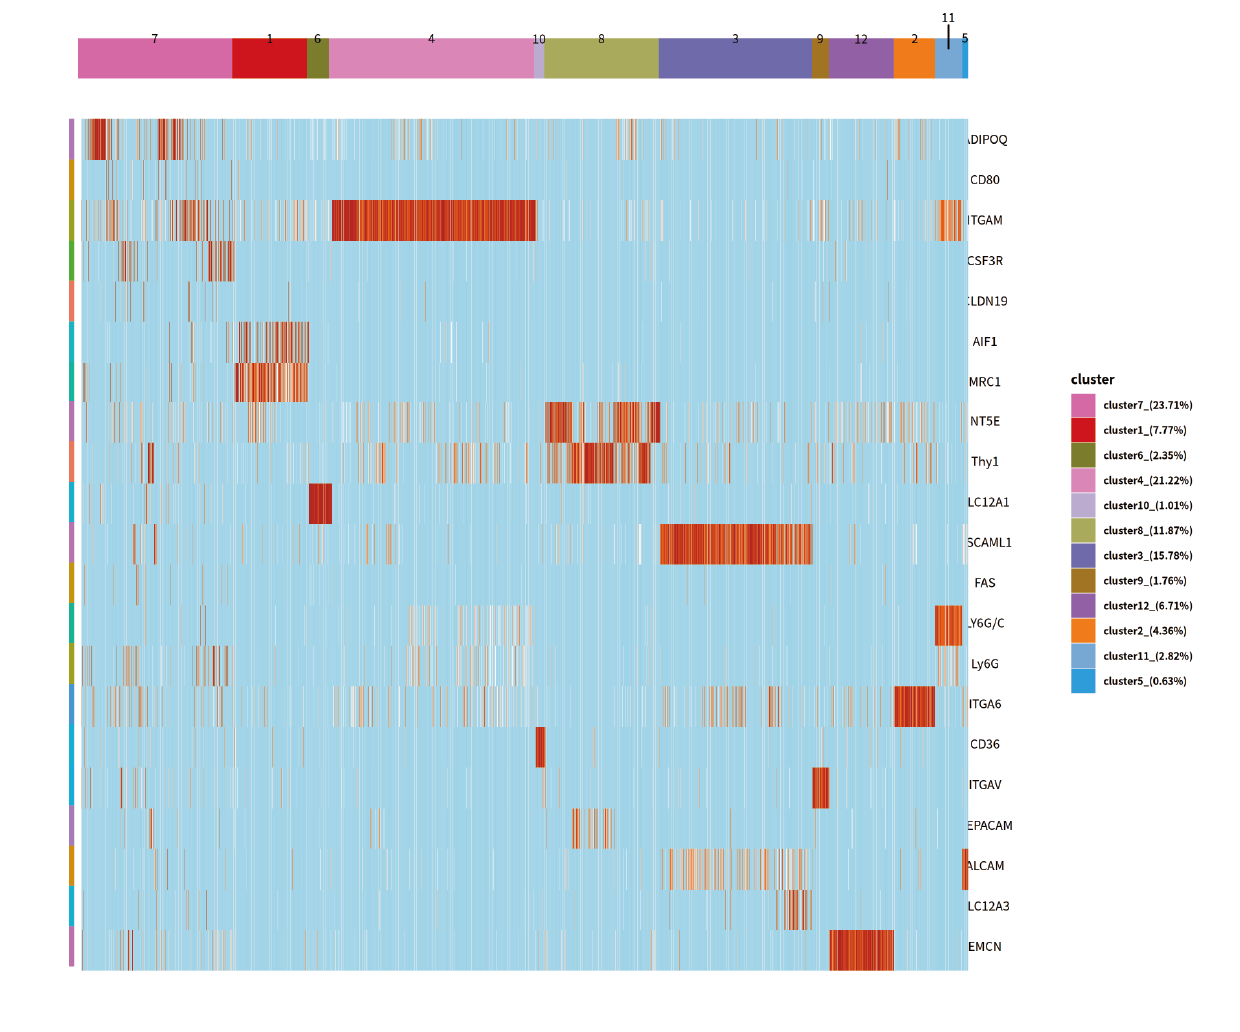
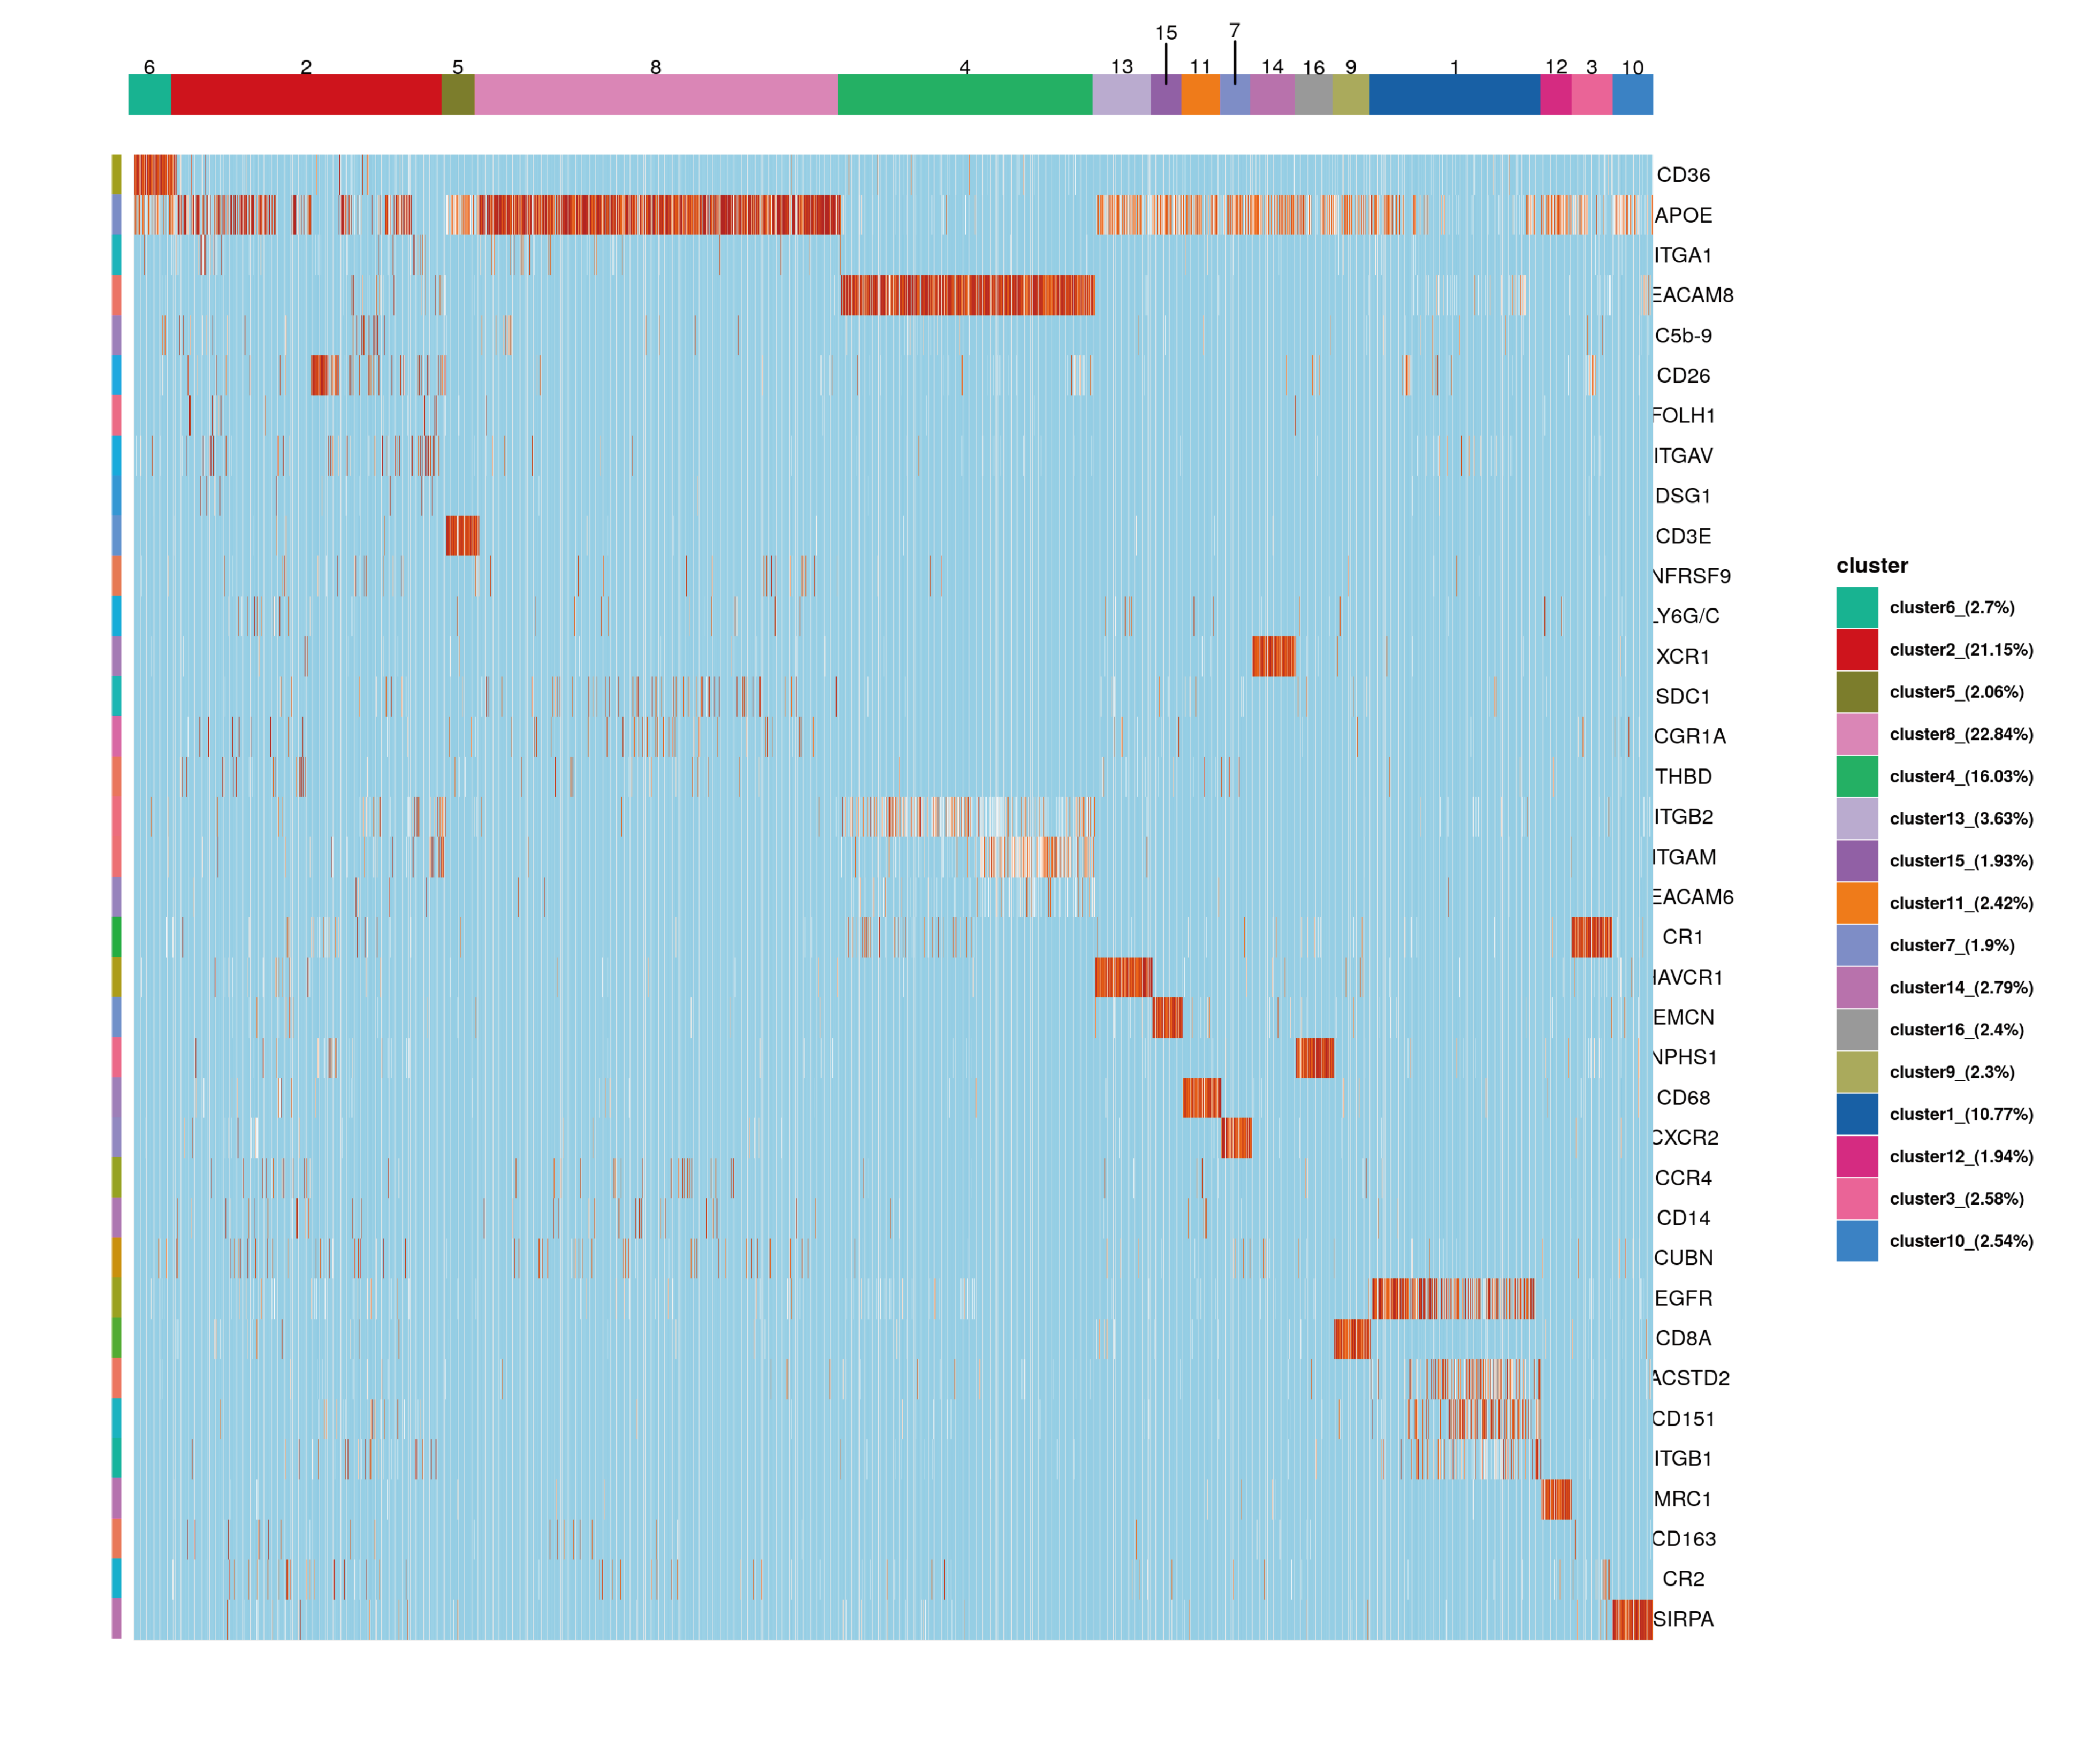
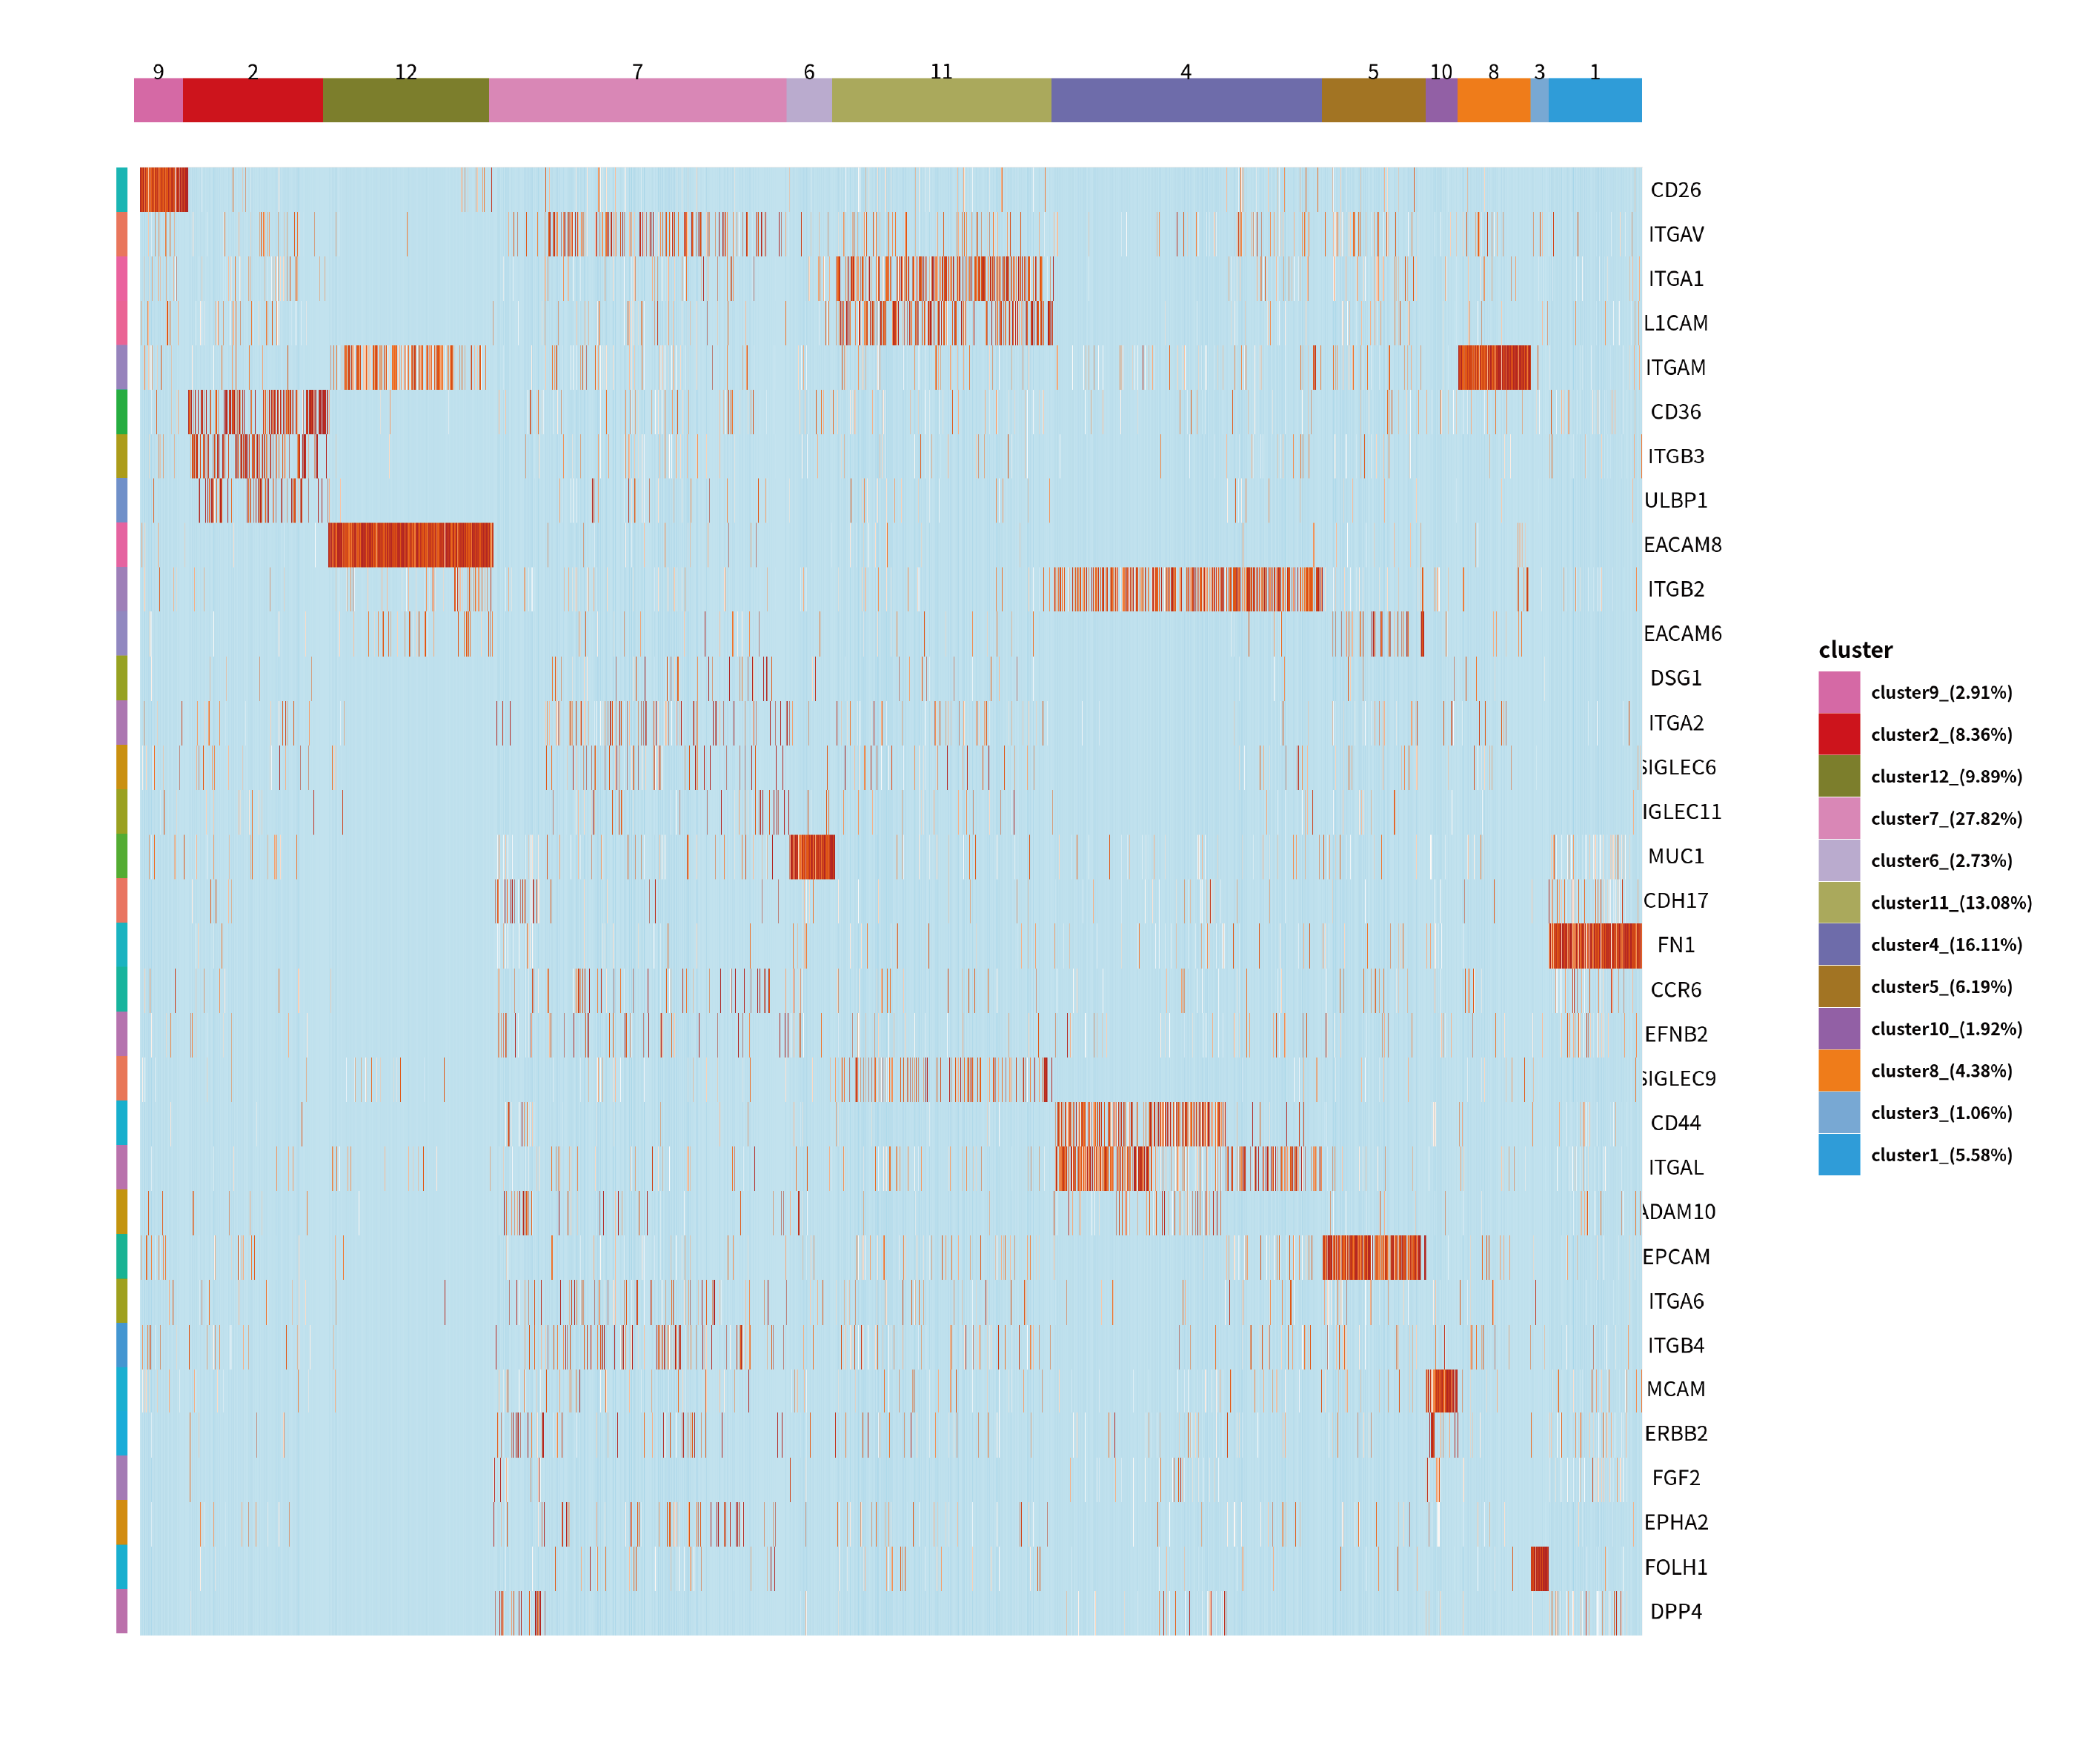
(3) Top ranked biomarkers defining each cluster
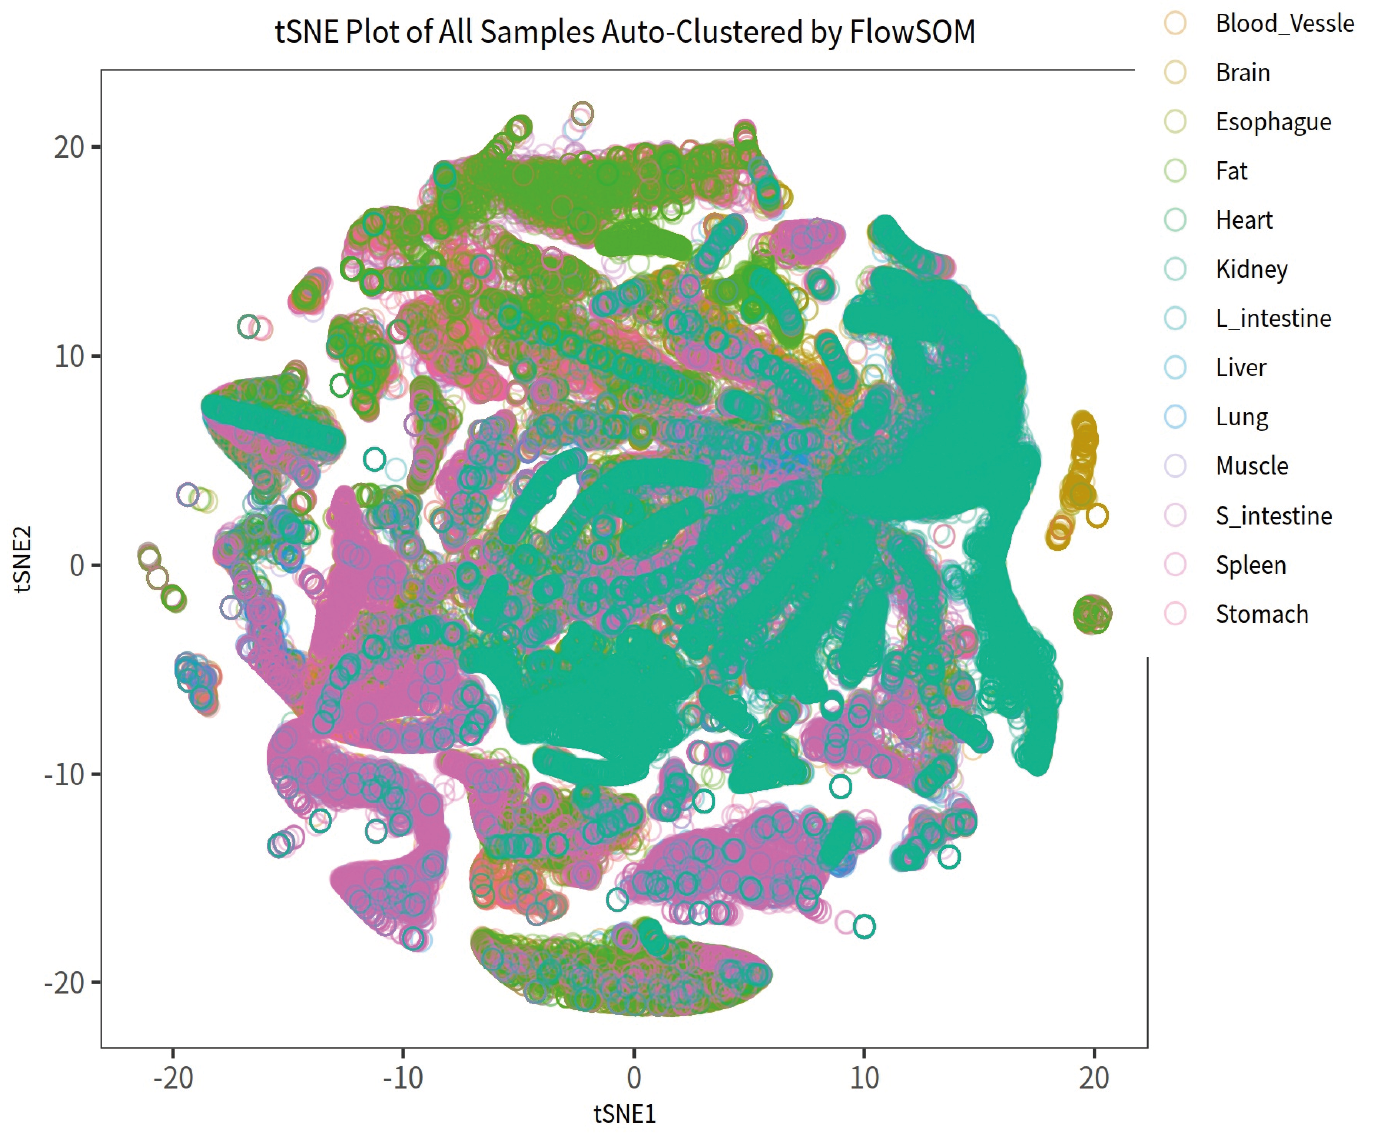
(4) Overall clustering across all samples:
Distinct subpopulation distributions were observed in digestive organs, bladder, kidney, and vasculature;
single-subpopulation analyses are detailed in the following “Heterogeneity.” section.

(1) Overall clustering across all samples
(2) Summary of clustering outcomes stratified by sample group
(3) Top ranked biomarkers defining each cluster

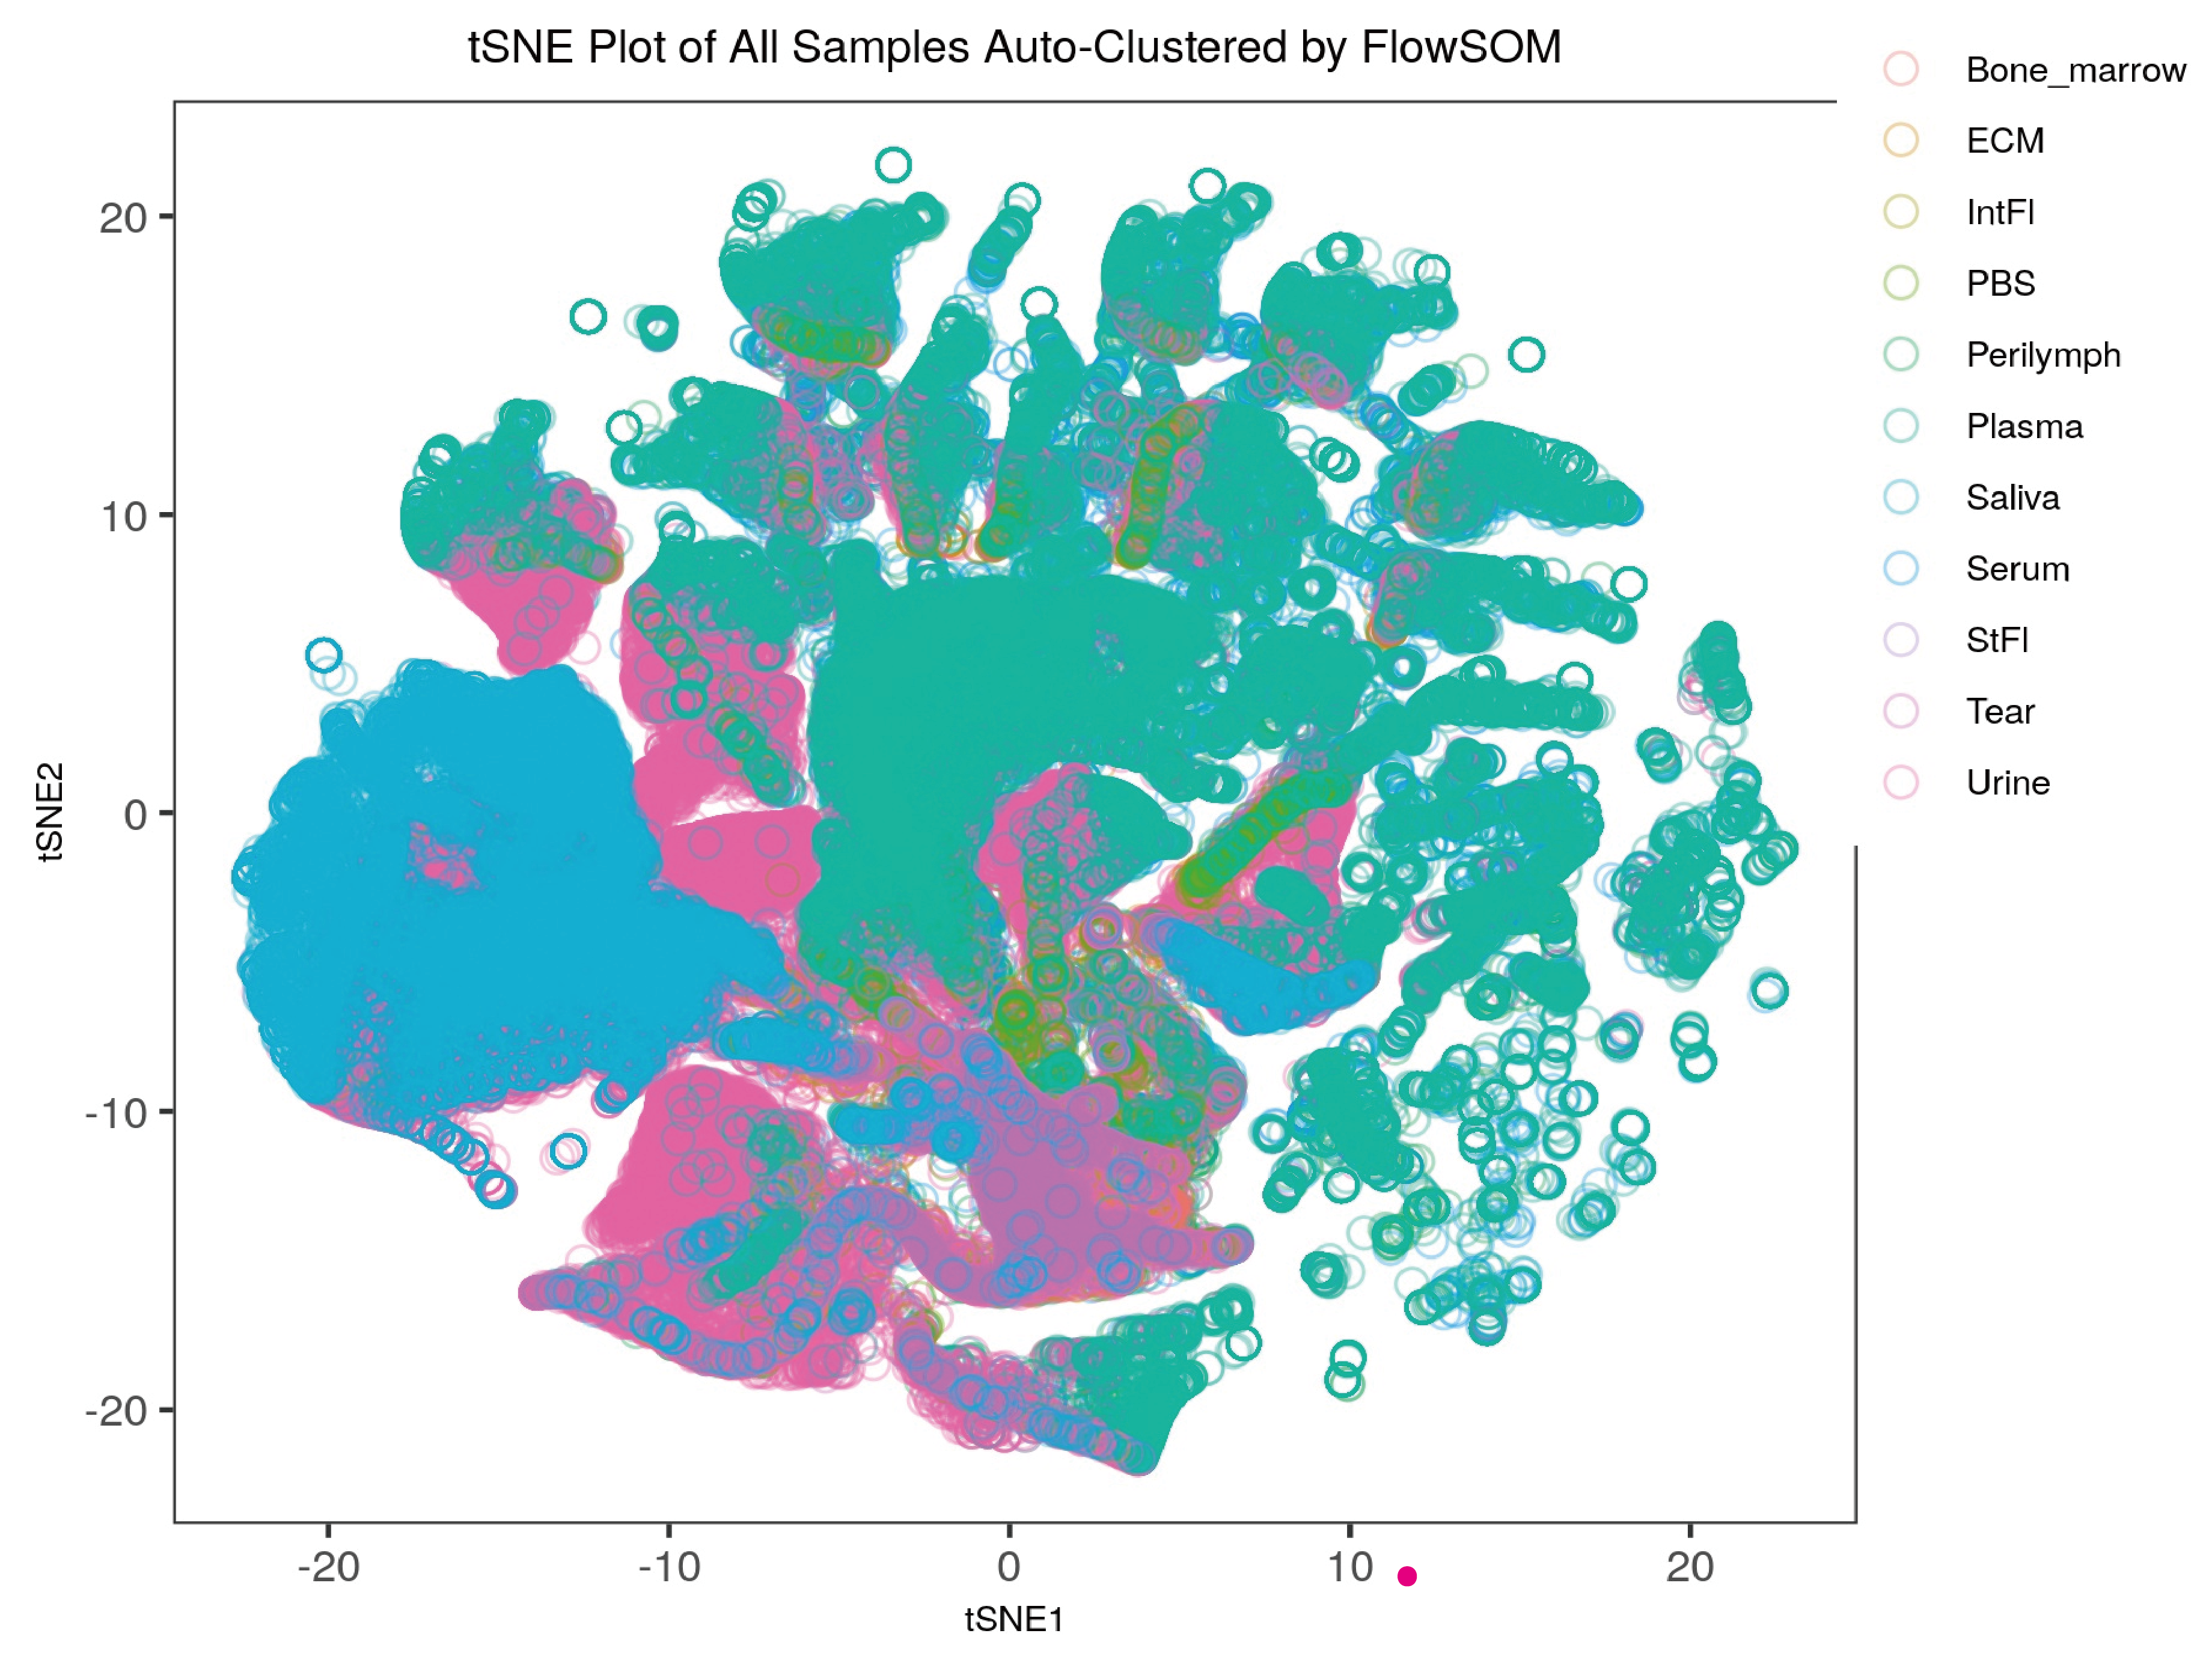
(4) Overall clustering across all samples:
Distinct subpopulation distributions were observed in saliva, urine, serum, plasma, and others;
detailed single‑subpopulation analyses are provided in the subsequent “Heterogeneity” section.
(1) Overall clustering across all samples
(2) Summary of clustering outcomes stratified by sample group
(3) Top ranked biomarkers defining each cluster
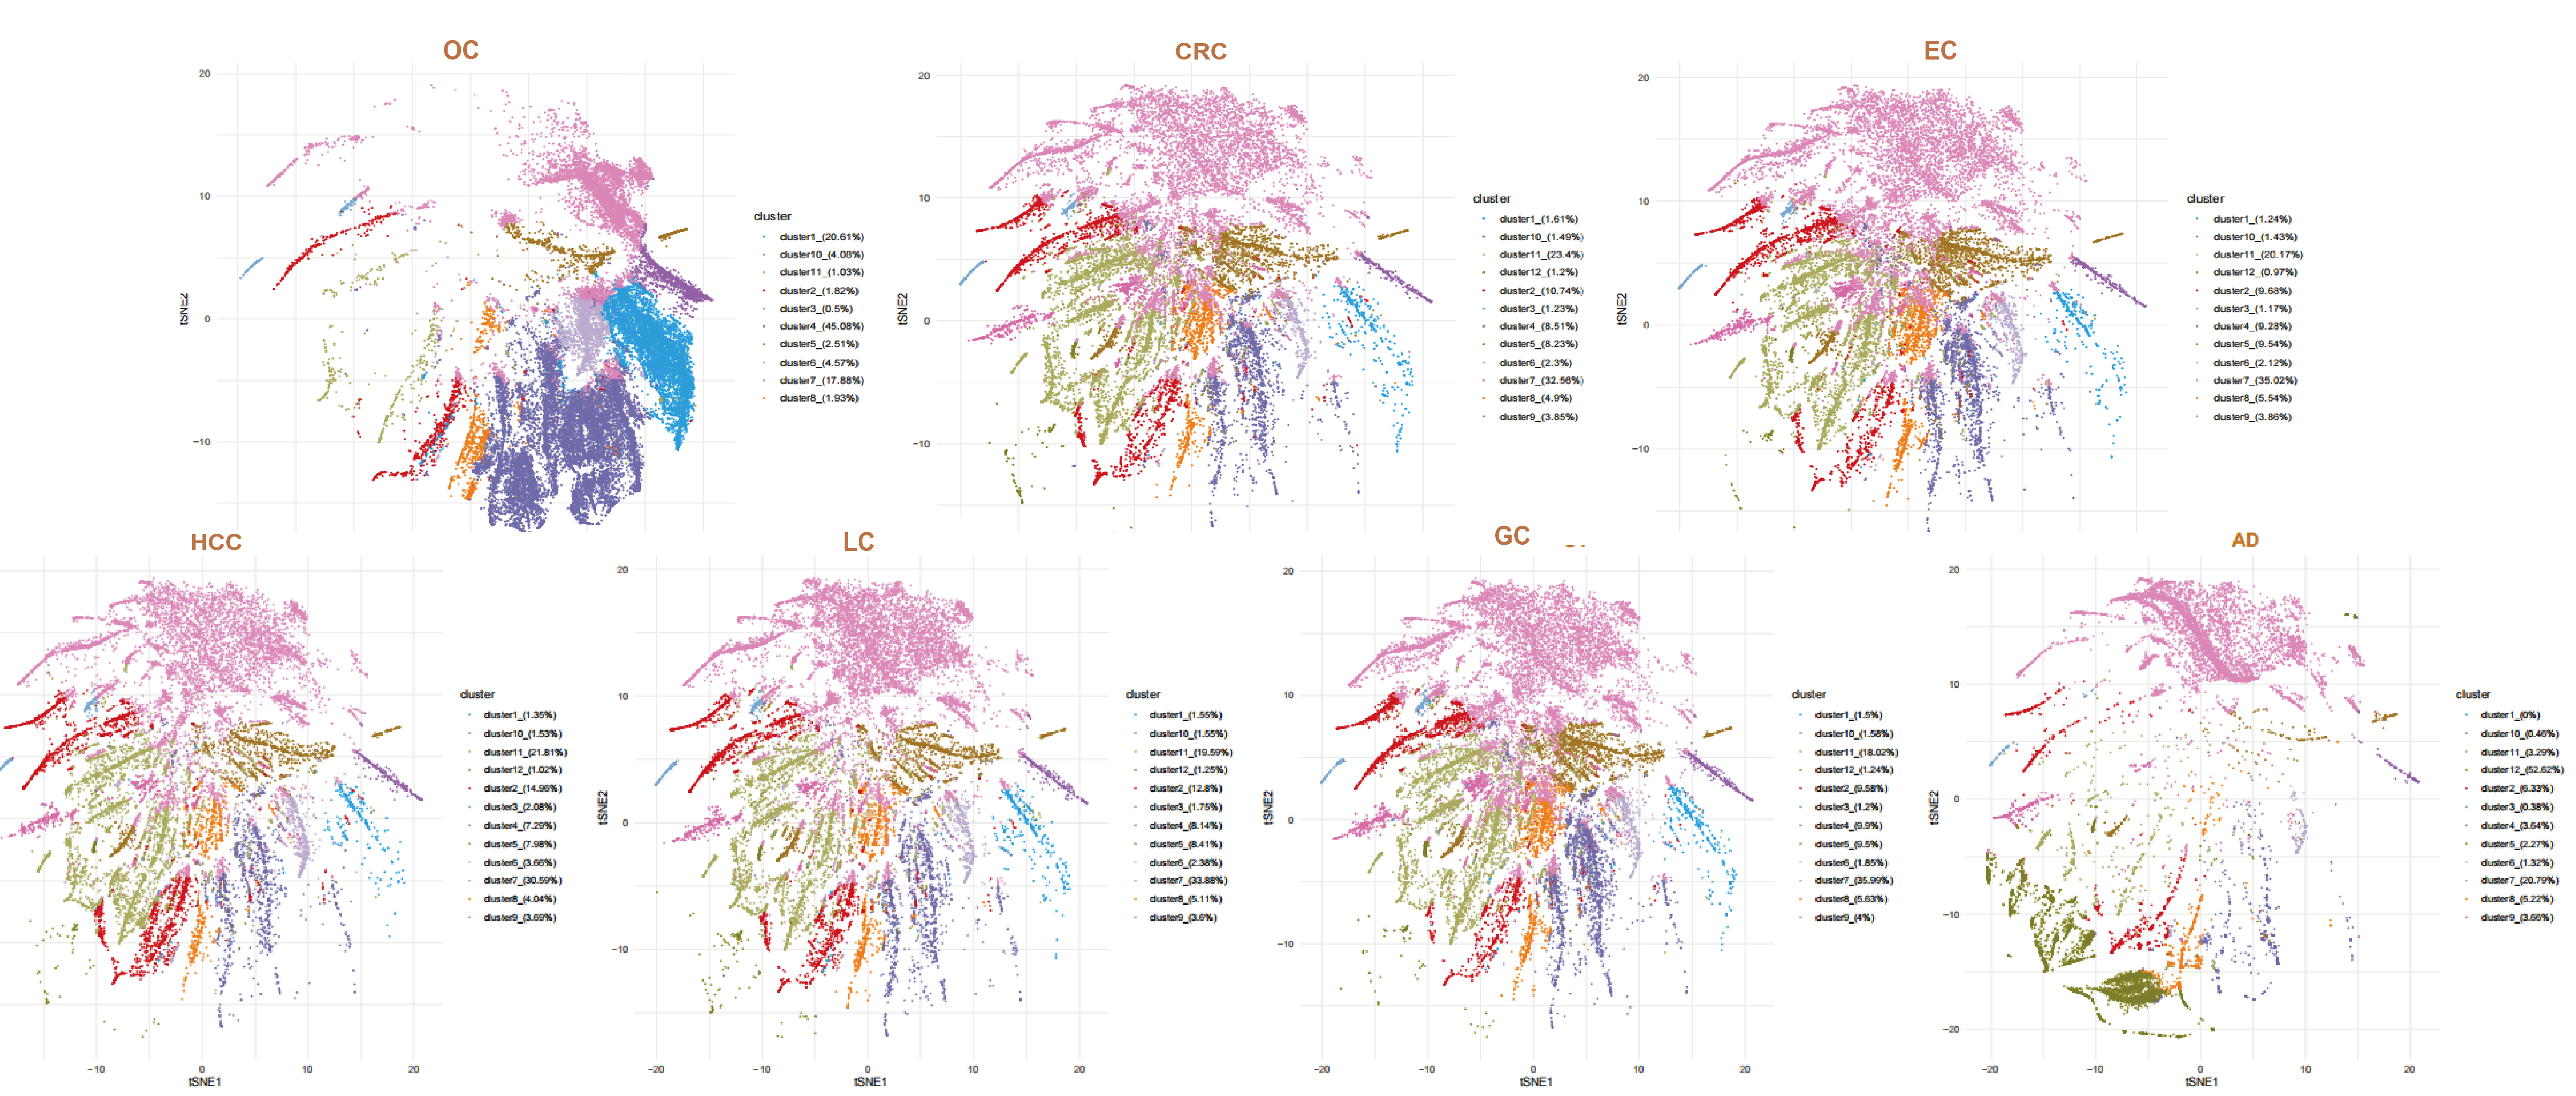
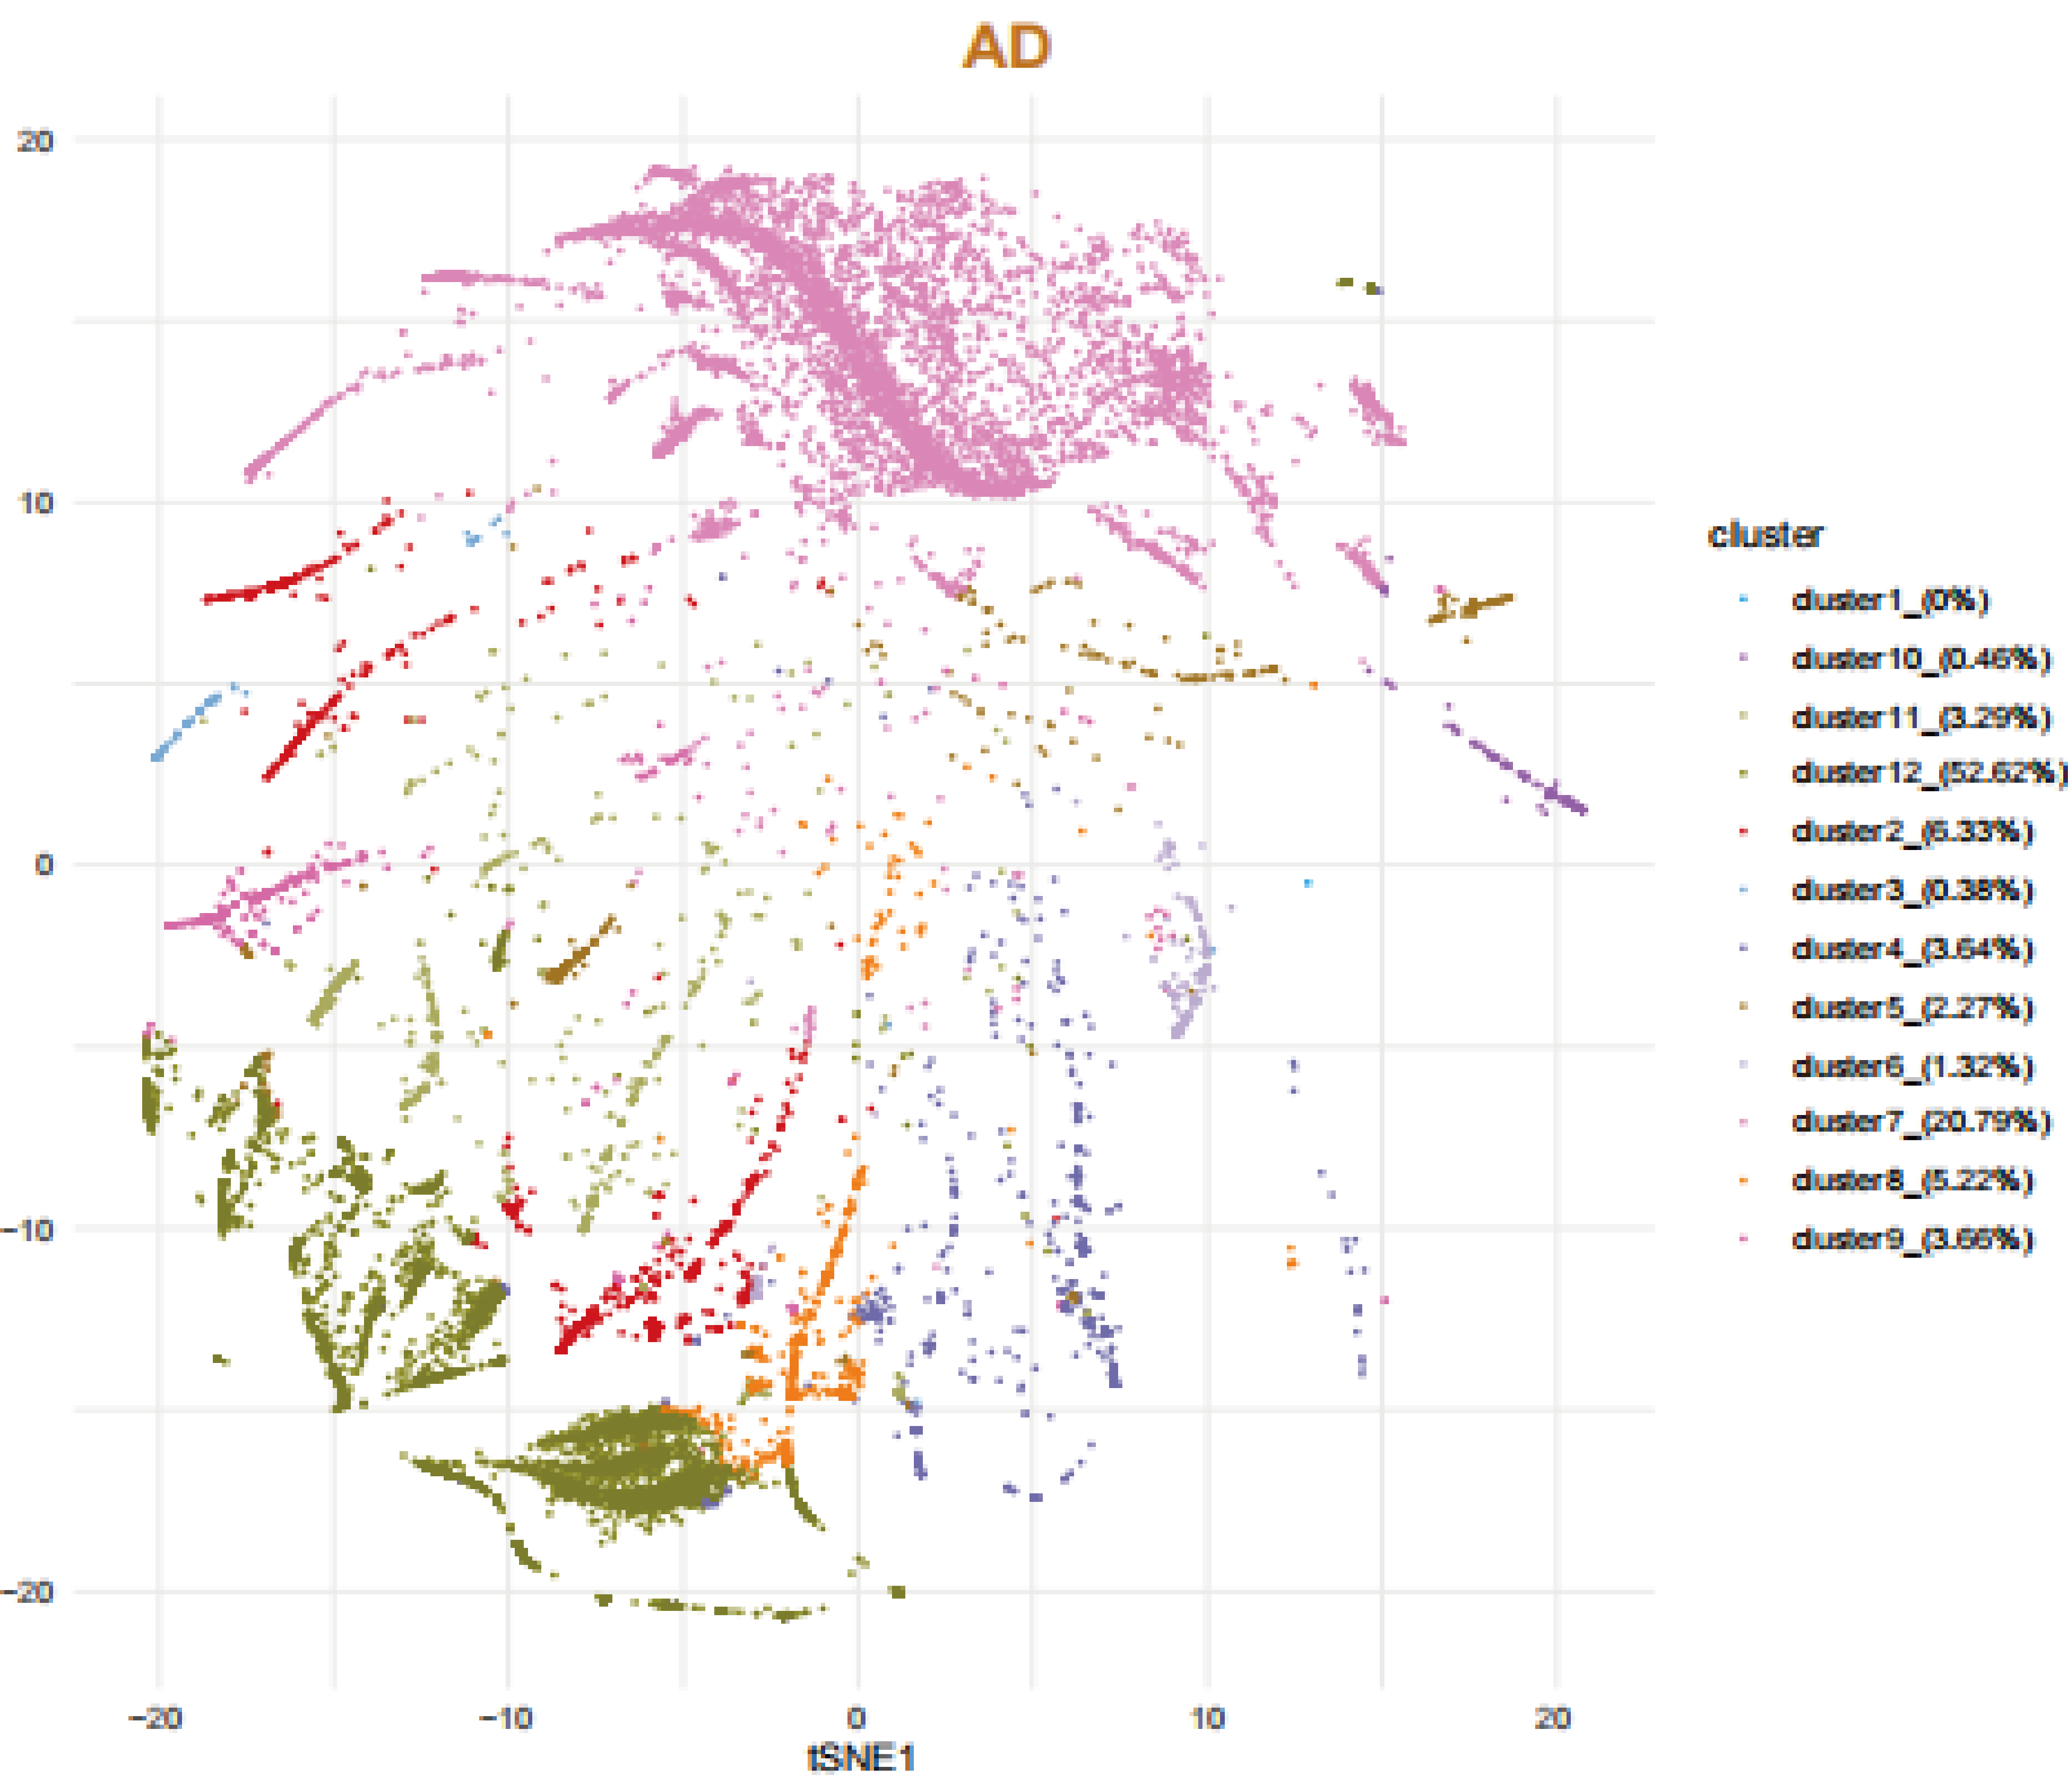
(4) Overall clustering across all samples:
Distinct subpopulation distributions were observed in AD, OC, CRC;
single-subpopulation analyses are detailed in the following “Heterogeneity.” section.
In our analyses, we observed substantial heterogeneity among single extracellular vesicles (EVs) across different sample sources. Subpopulations have the potential to serve as critical indicators of tissue origin, highlighting a unique advantage of single-EV profiling.
Below, we select several highly specific subpopulations for further analysis of their distribution across samples, source composition, and highly expressed markers. The figures illustrate single-EV heterogeneity, highlighting distinct molecular profiles.
Origin: Kidney
Specific subpopulation: cluster1 : 72.43%


(1) SNE plot of the kidney groups across all organs.
(2) Distribution of Cluster 1 across all organs.
(3) Proportion of Cluster 1 across organs and its top protein expression.
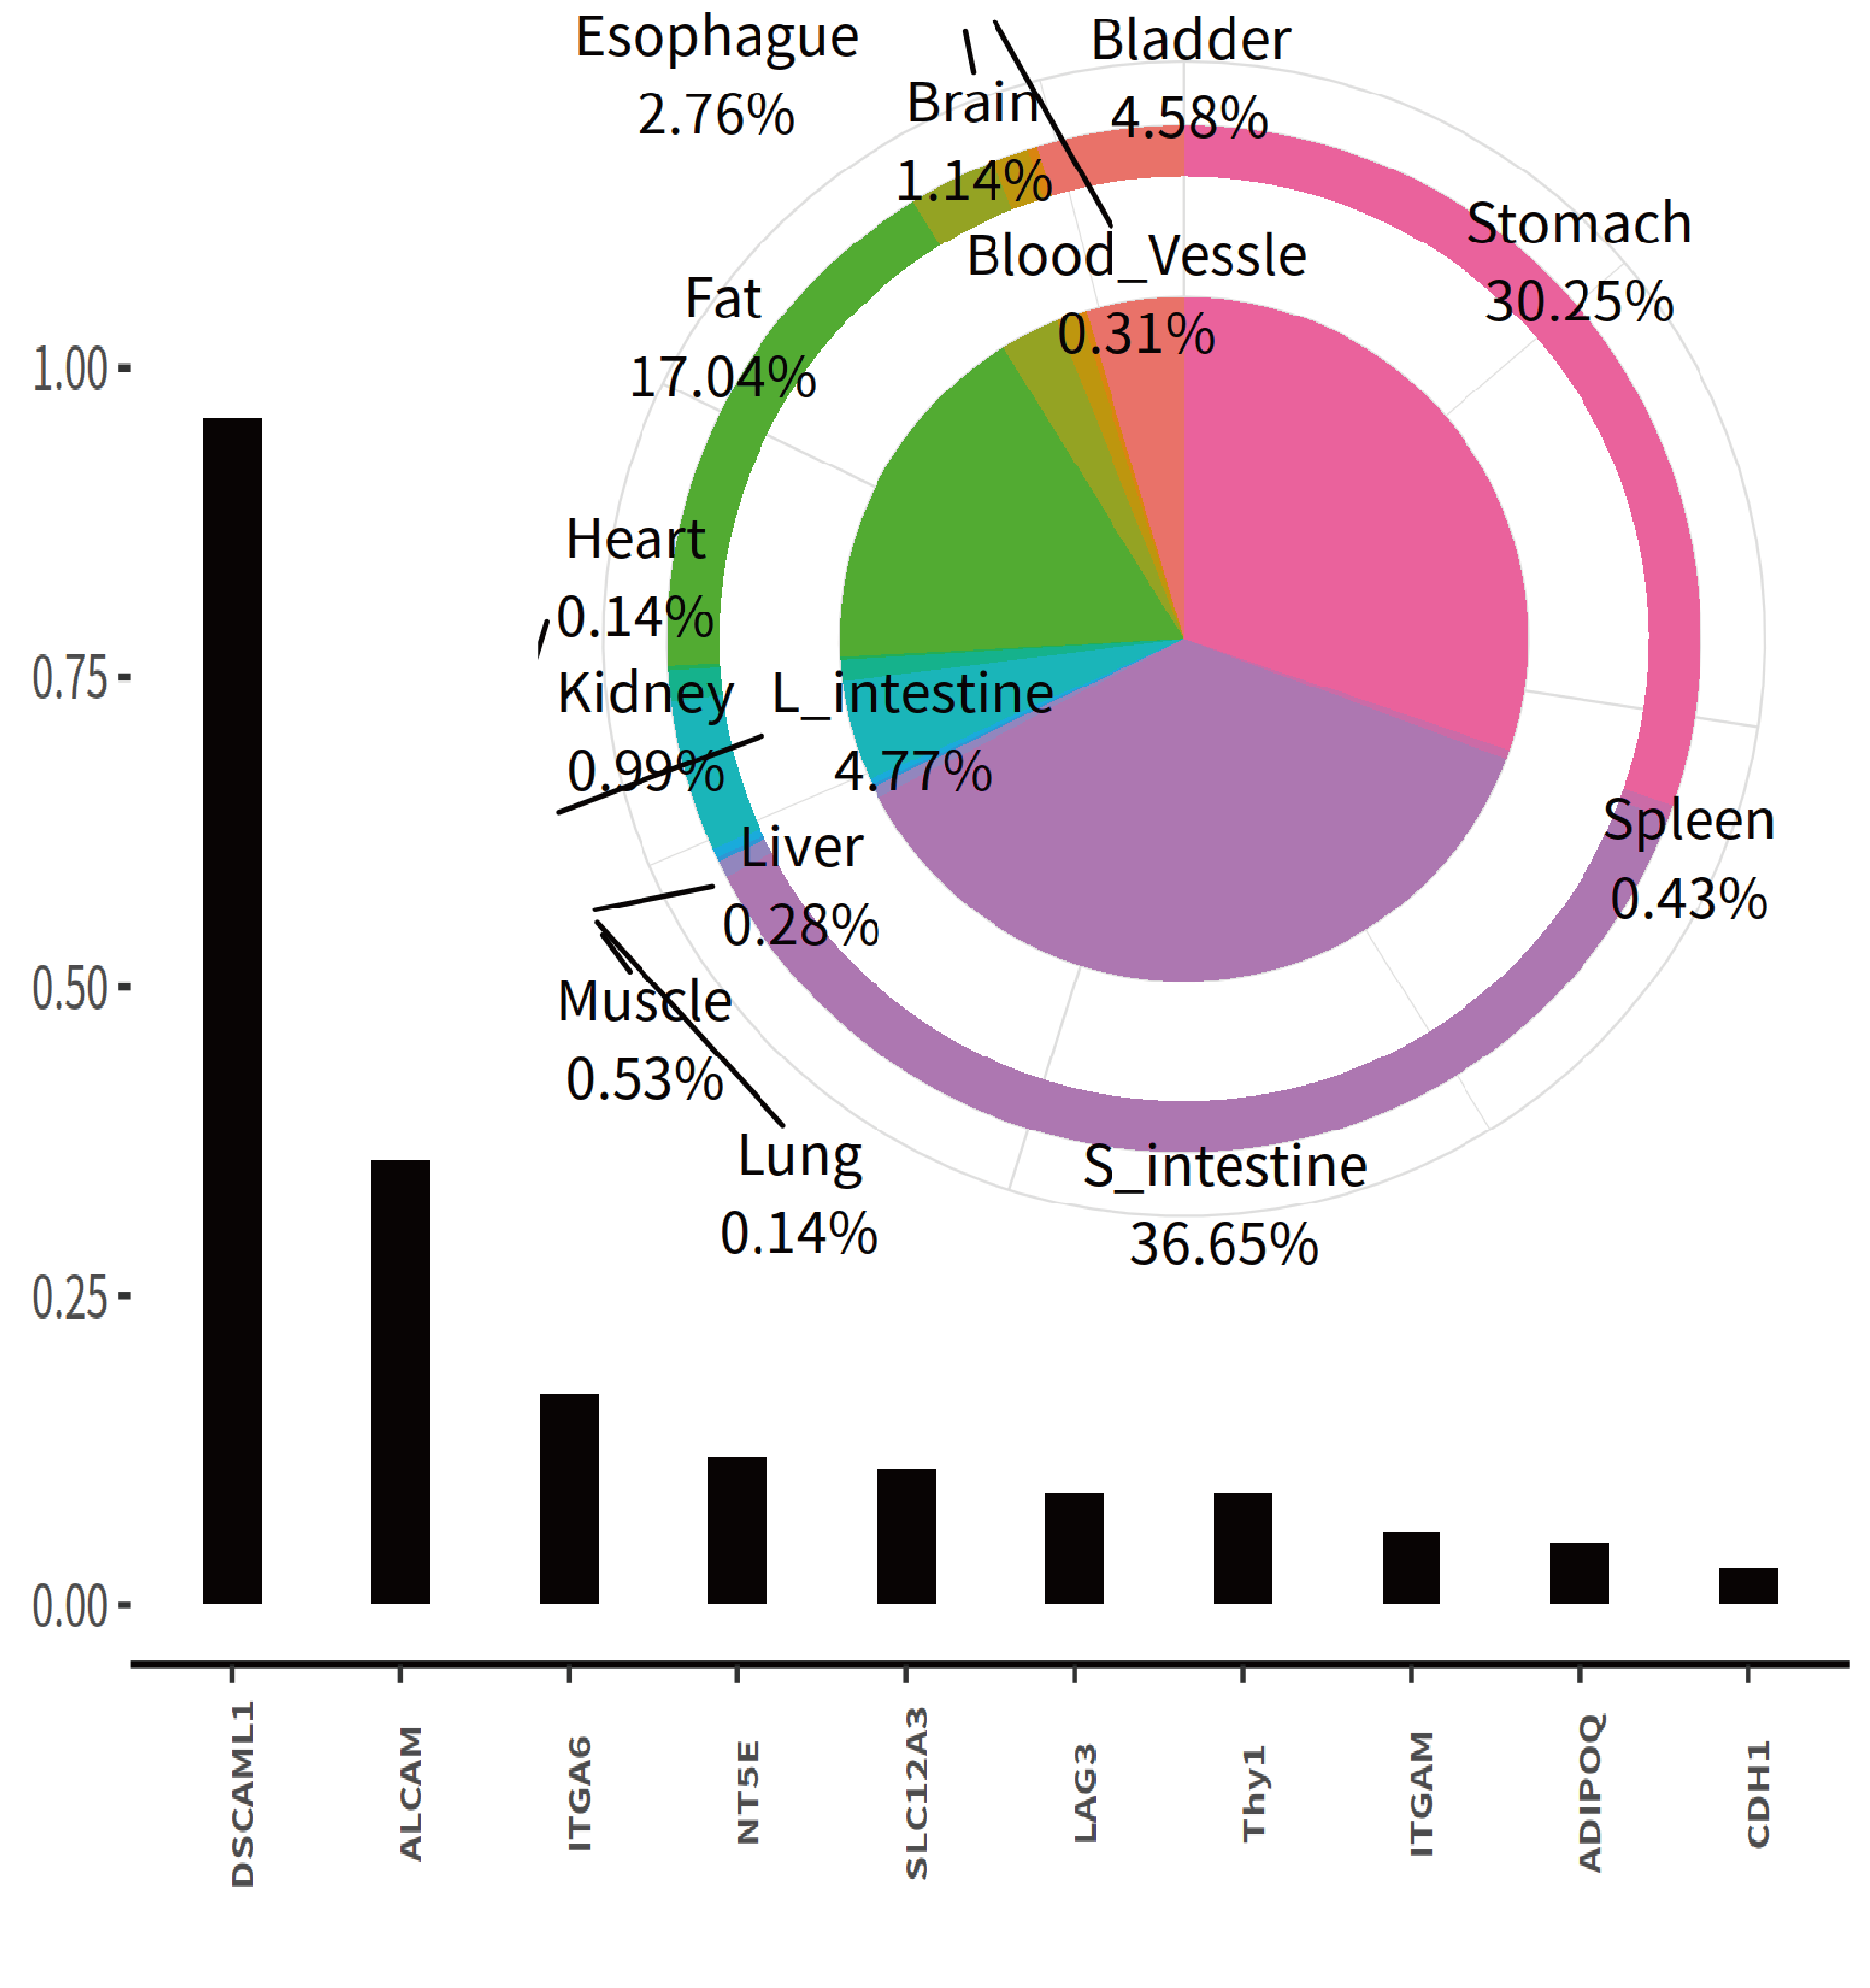
Origin: Stomach/Intestine
Specific subpopulation: cluster17: 86.35%
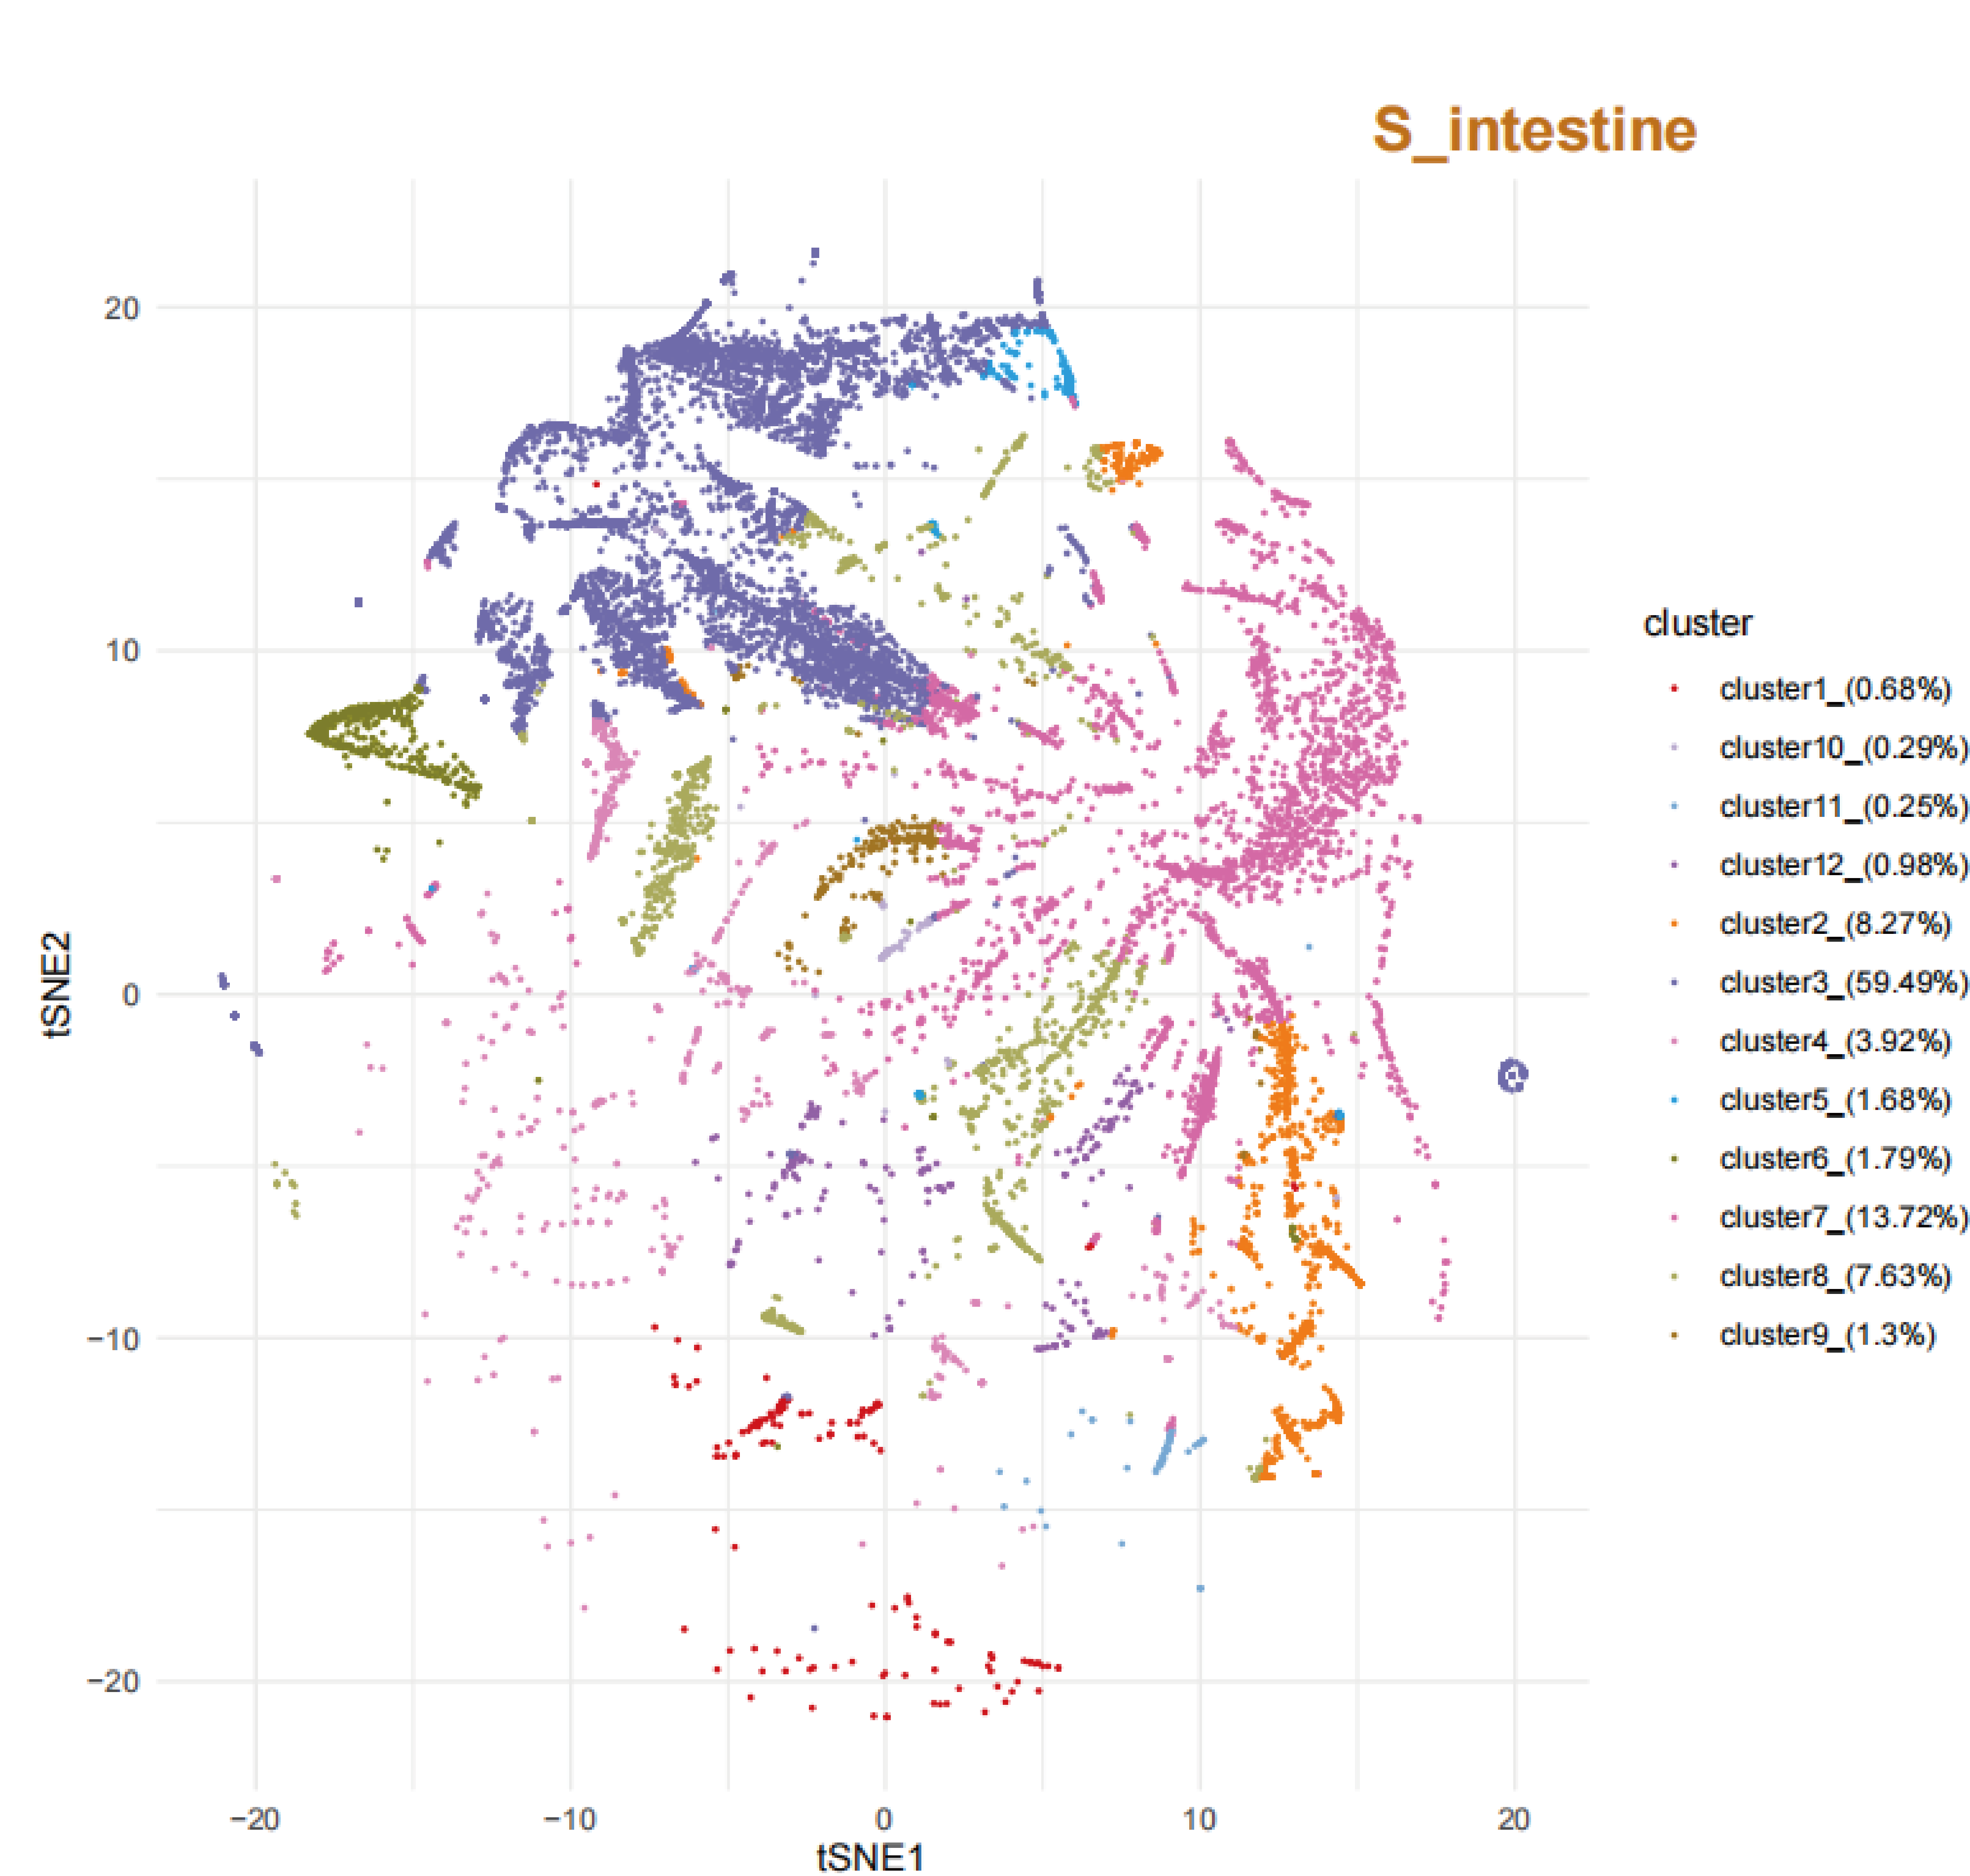
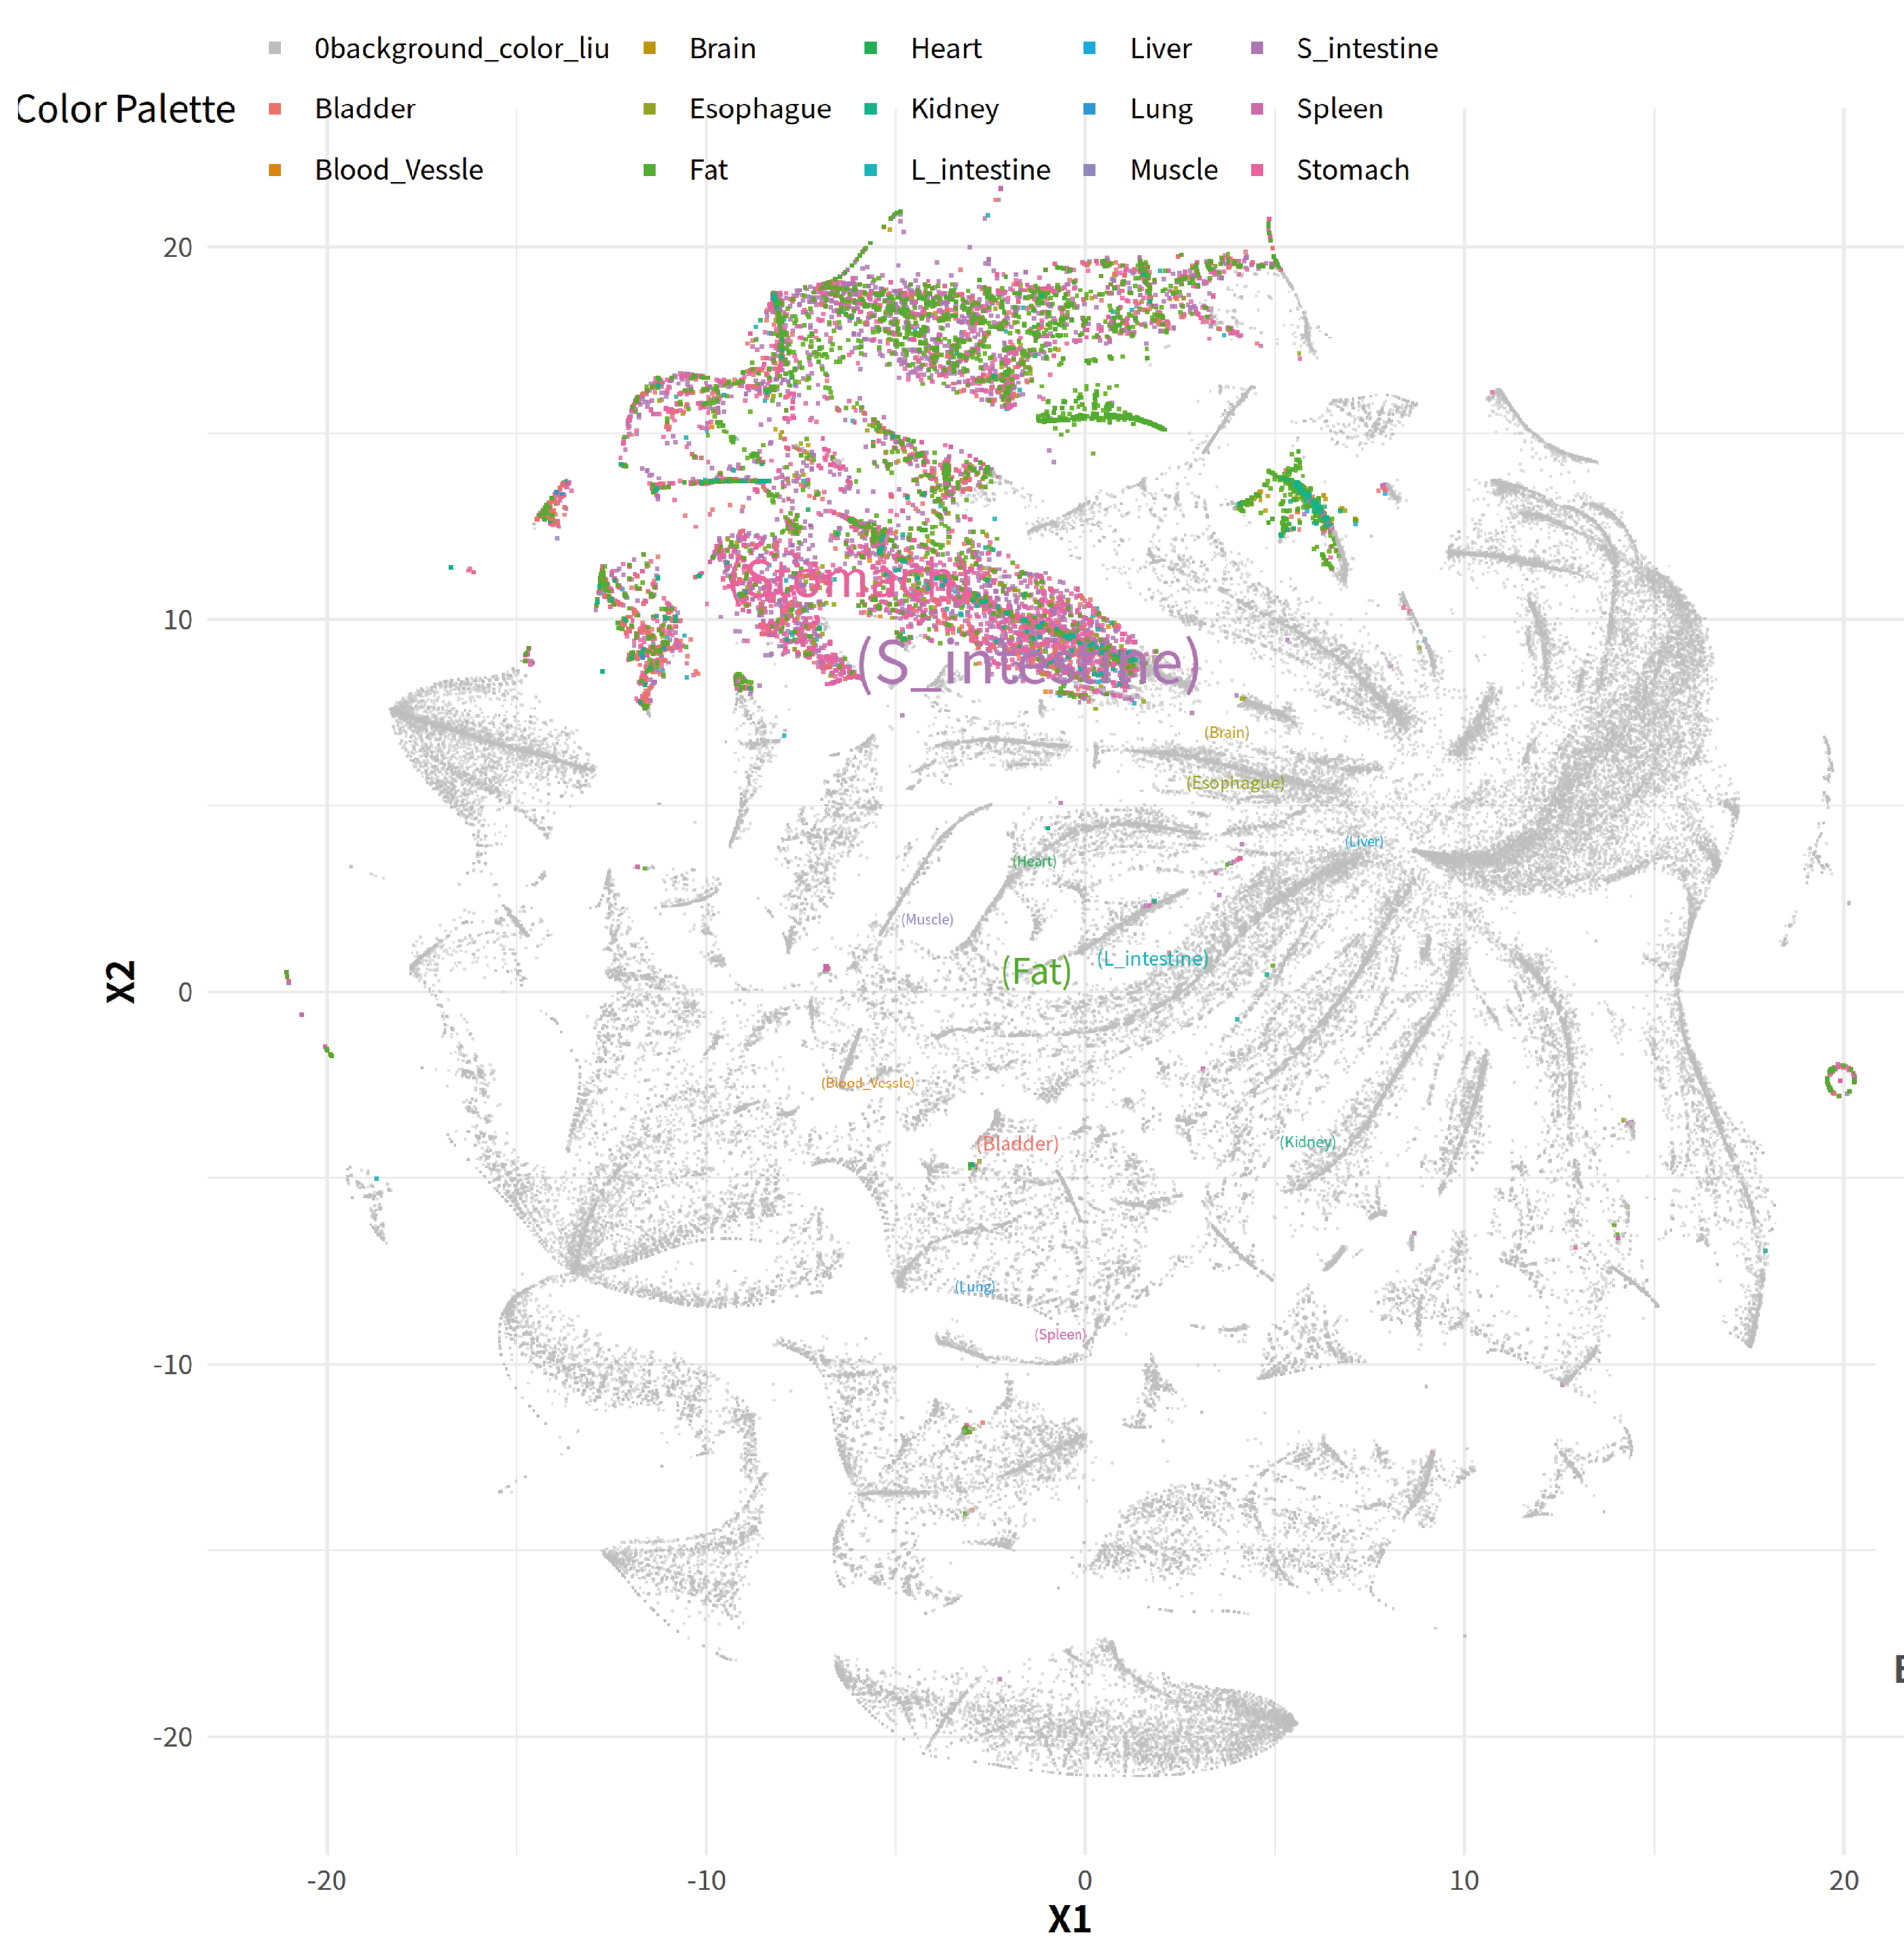
(1) SNE plot of the Intestine groups across all organs.
(2) Distribution of Cluster 3 across all organs.
(3) Proportion of Cluster 3 across organs and its top protein expression.
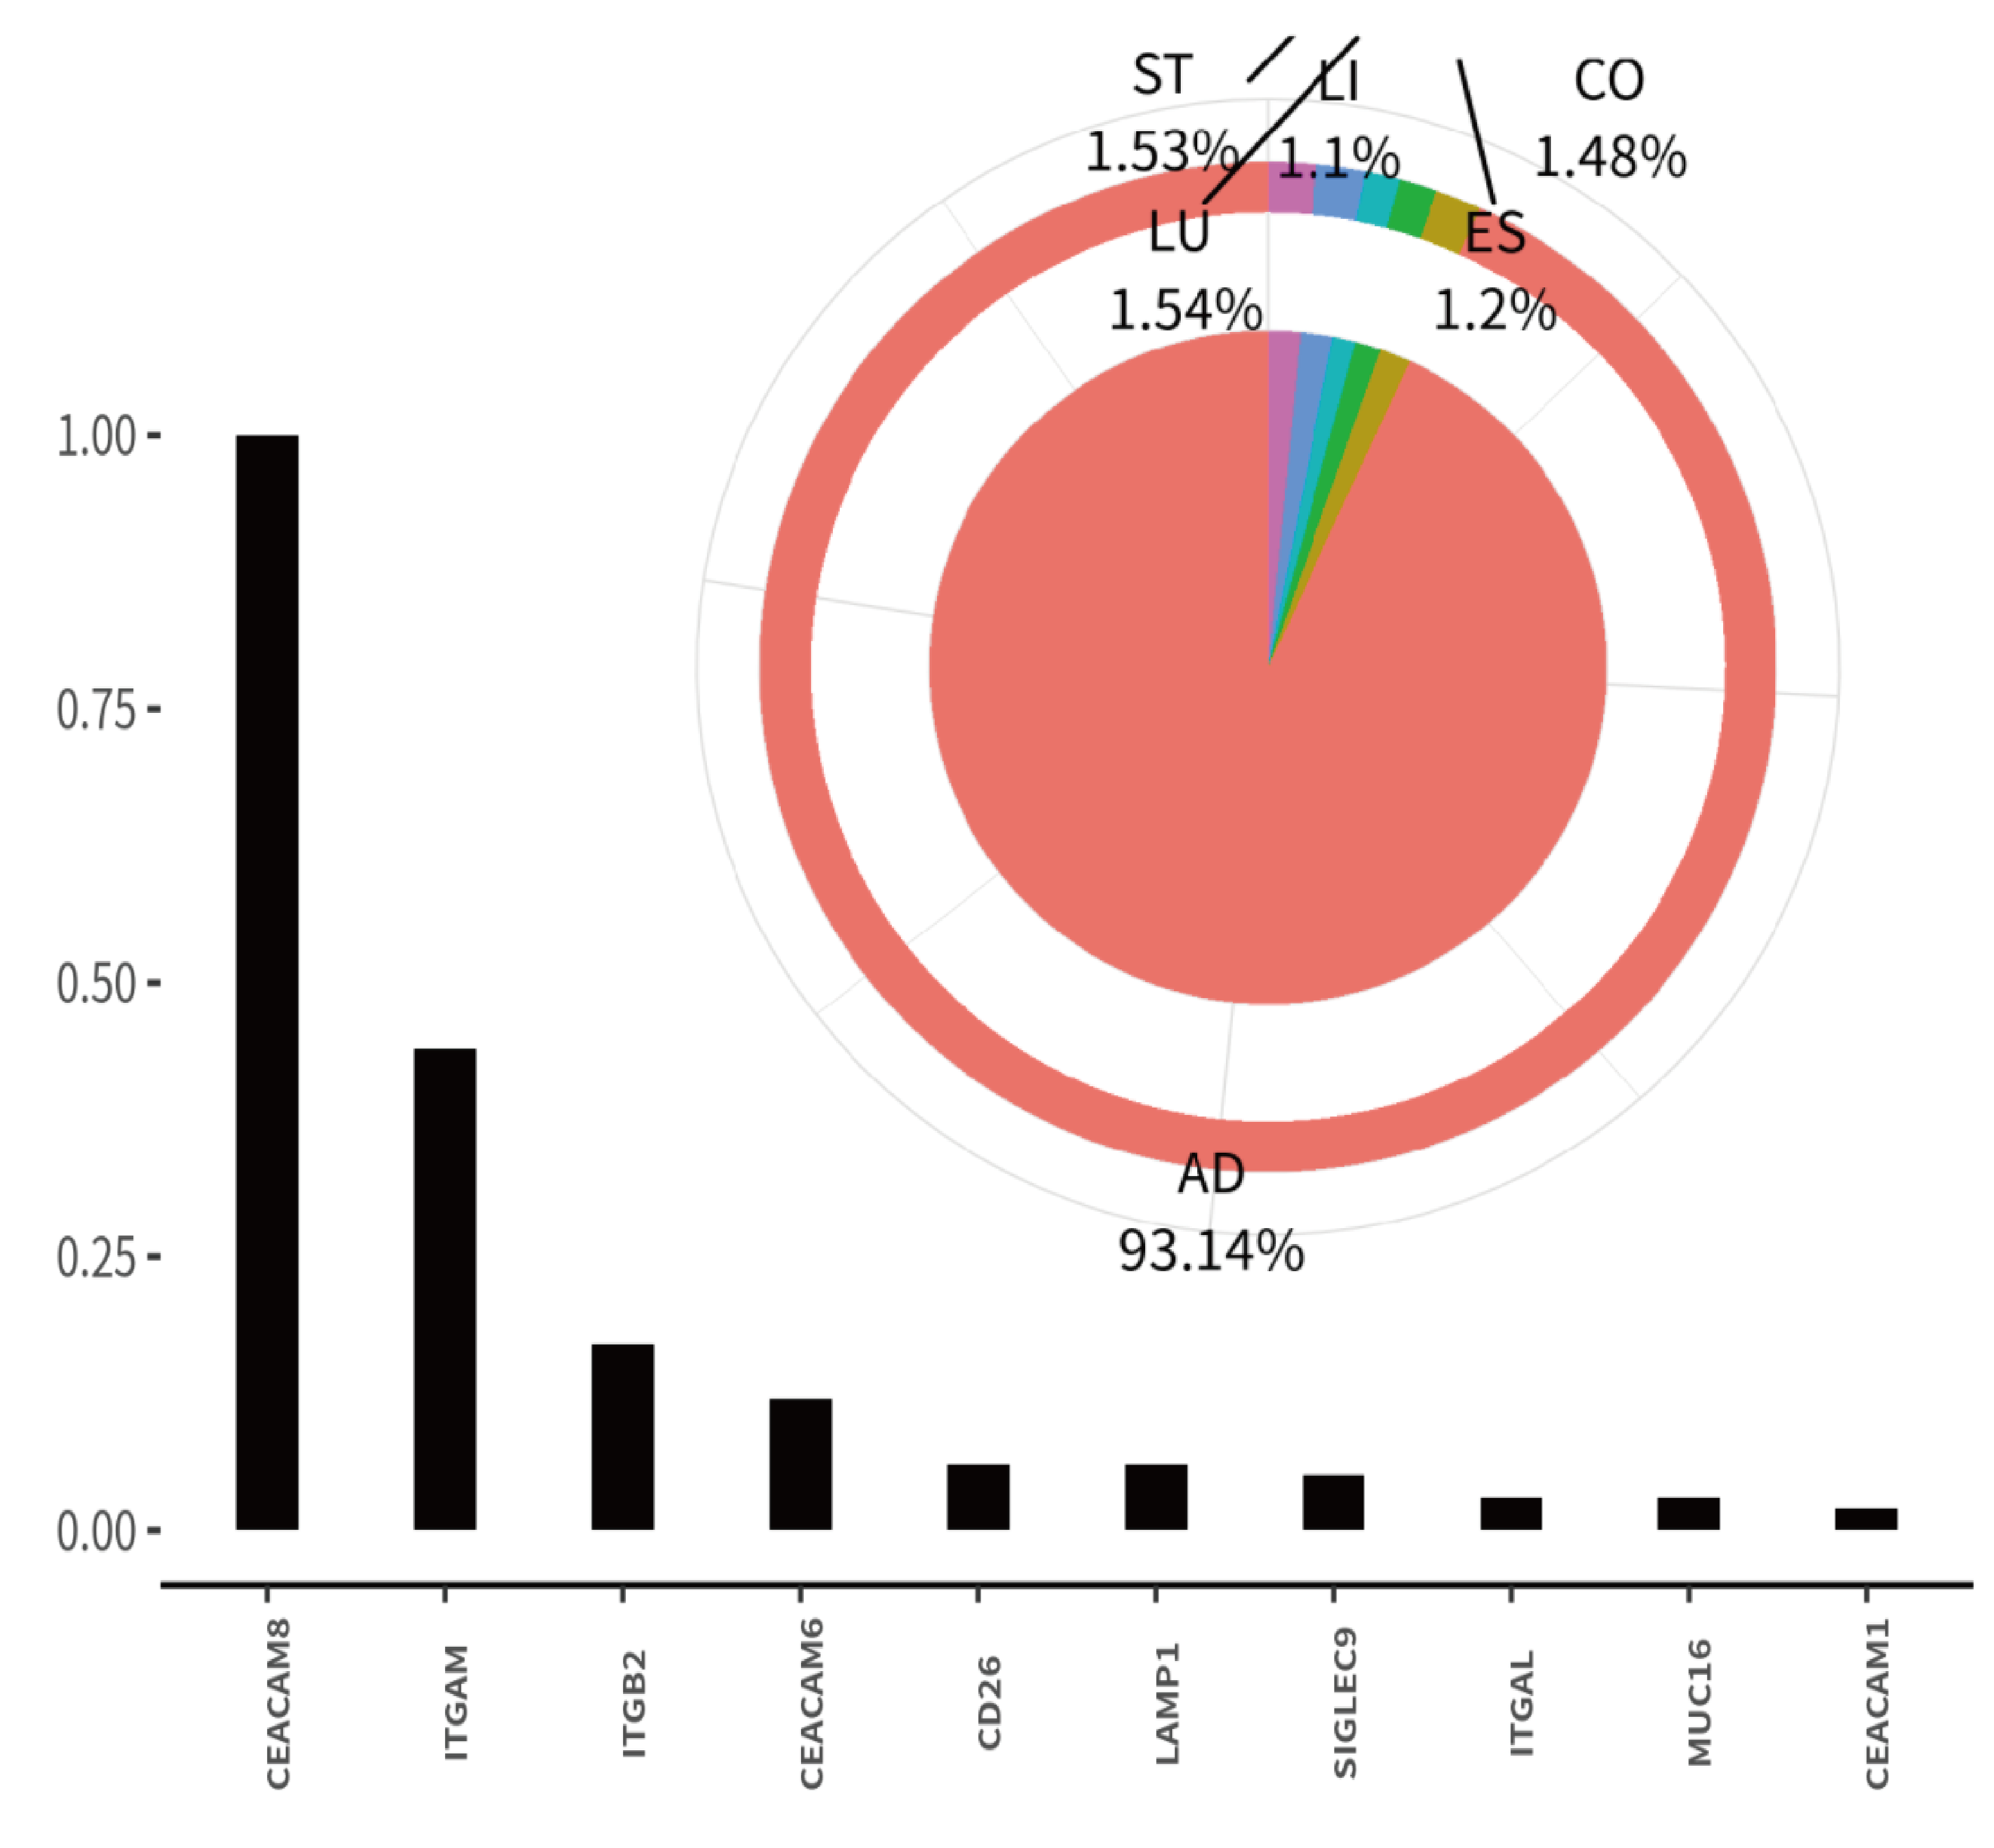
Disease: Ovarian Cancer
Specific subpopulation: cluster 1:84.5%
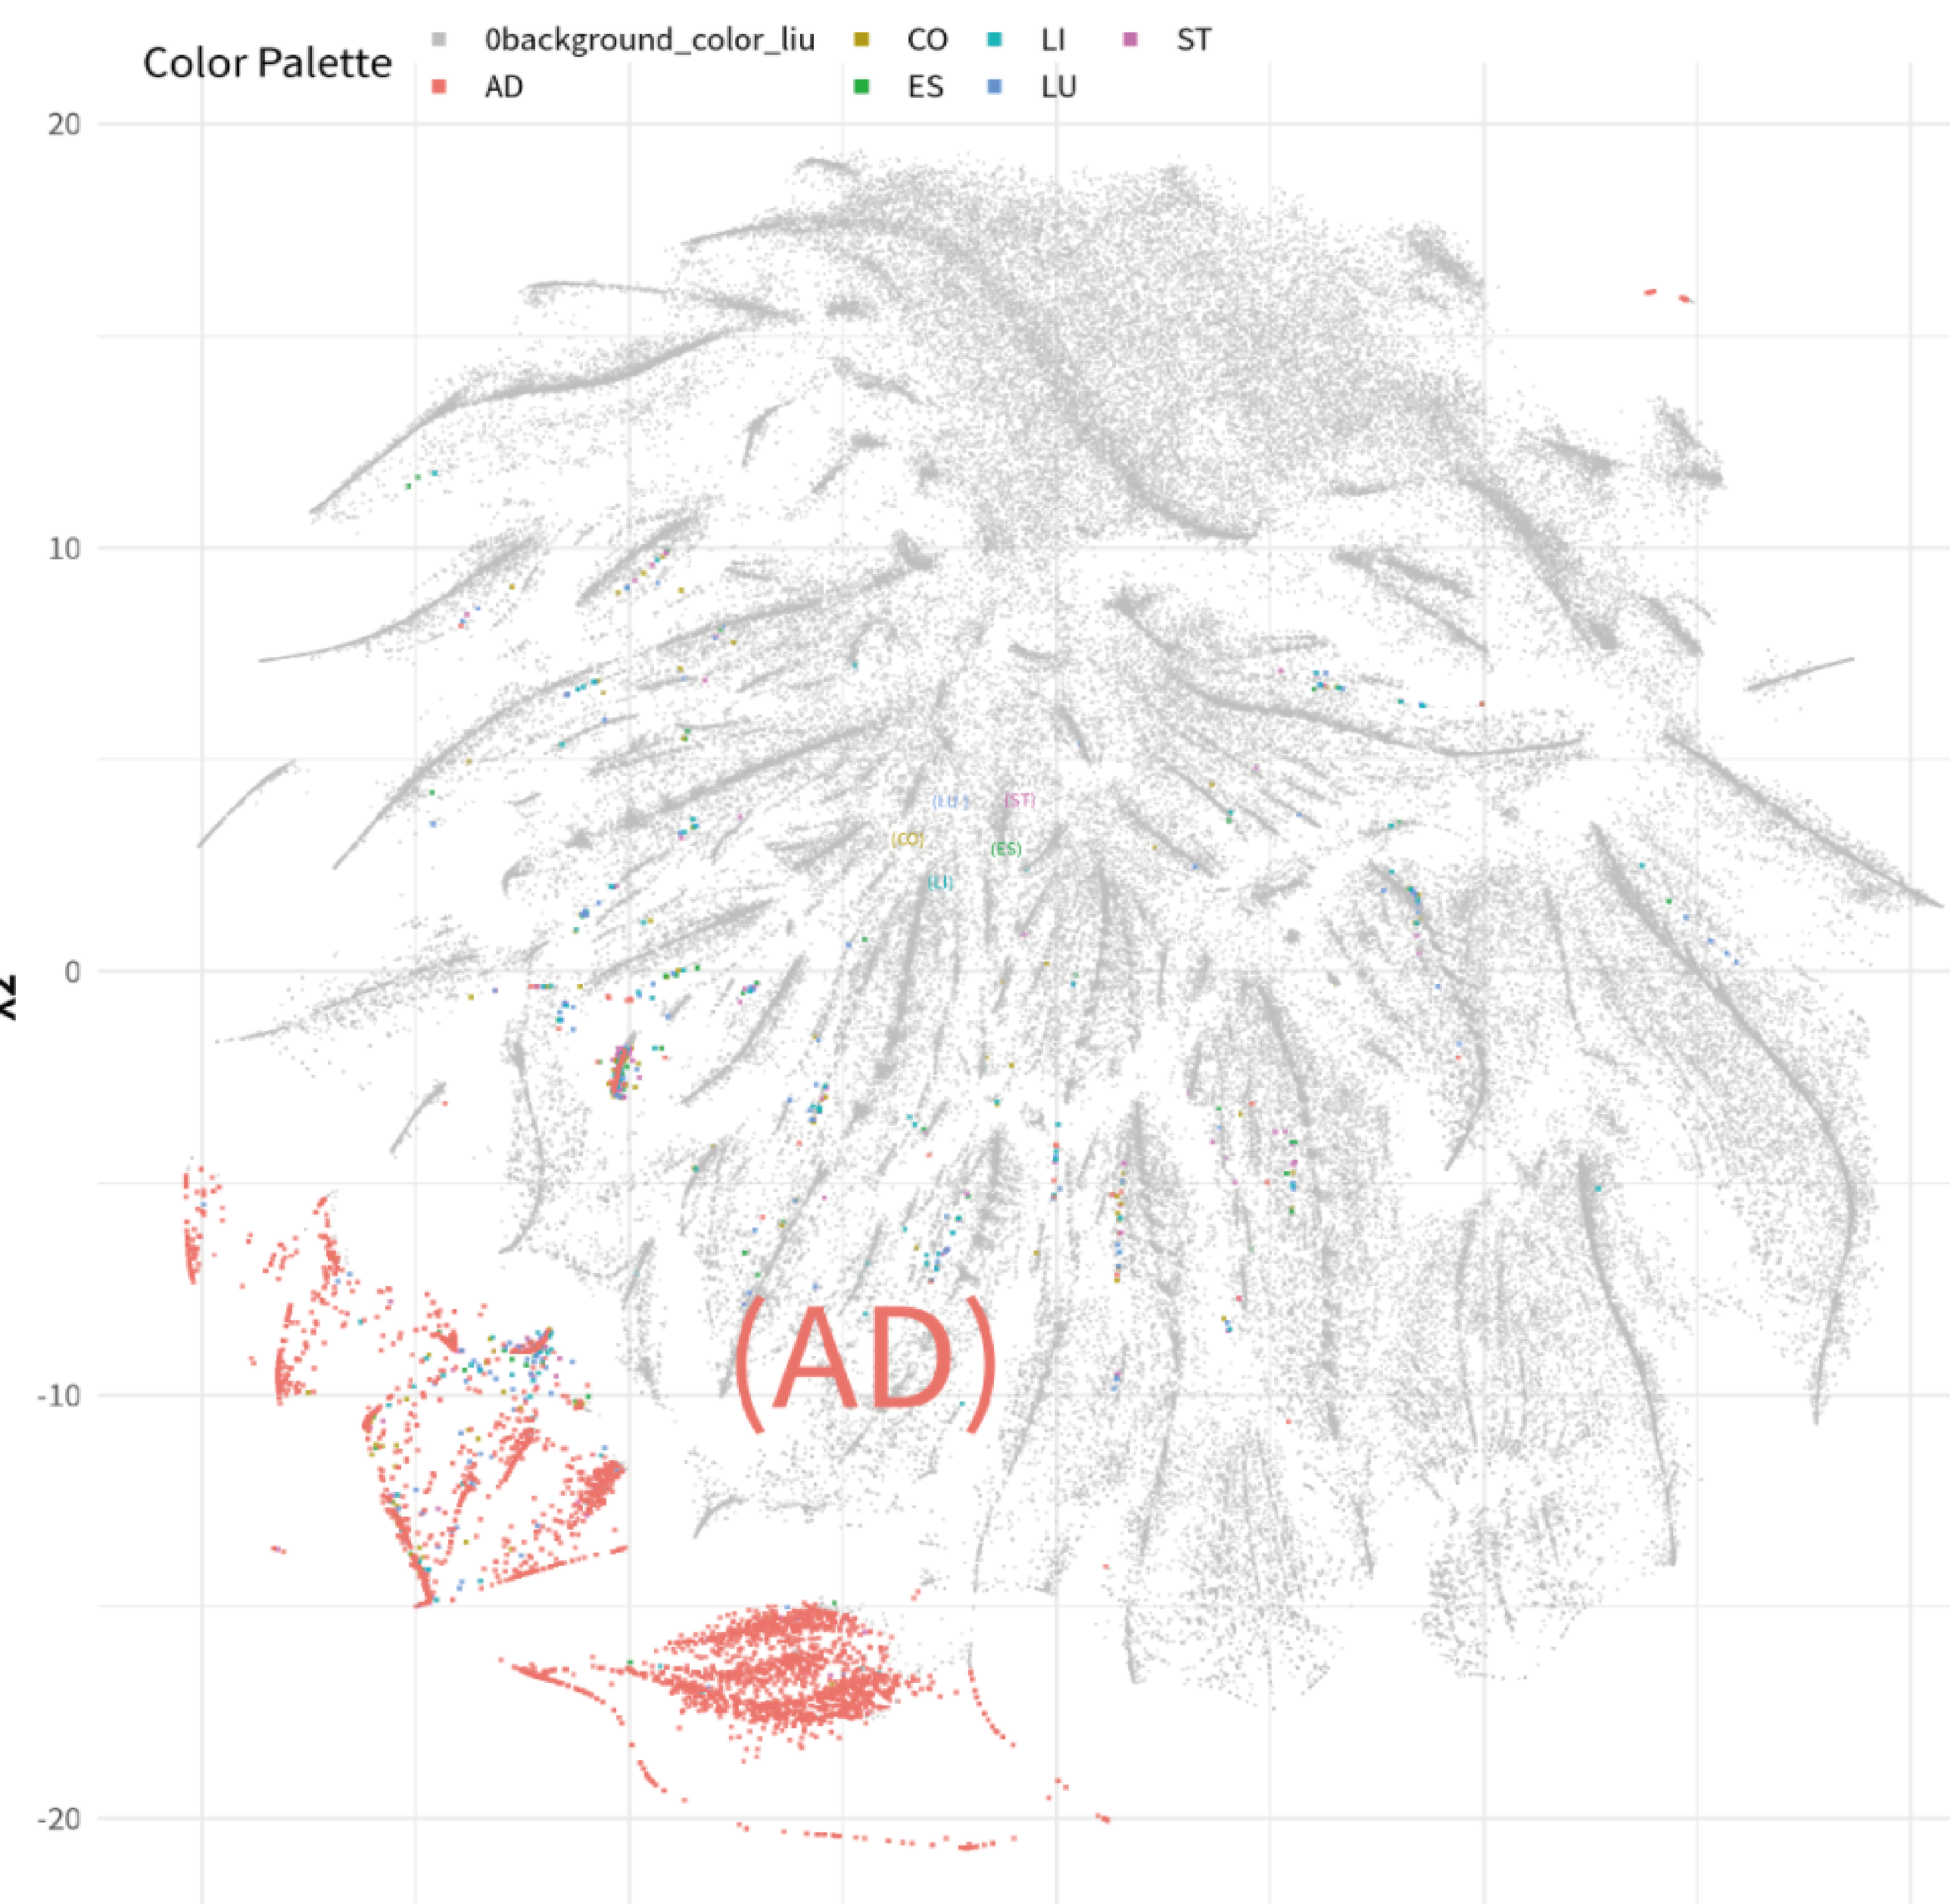
(1) SNE plot of the Ovarian Cancer groups across all organs.
(2) Distribution of Cluster 1 across all organs.
(3) Proportion of Cluster 1 across organs and its top protein expression.
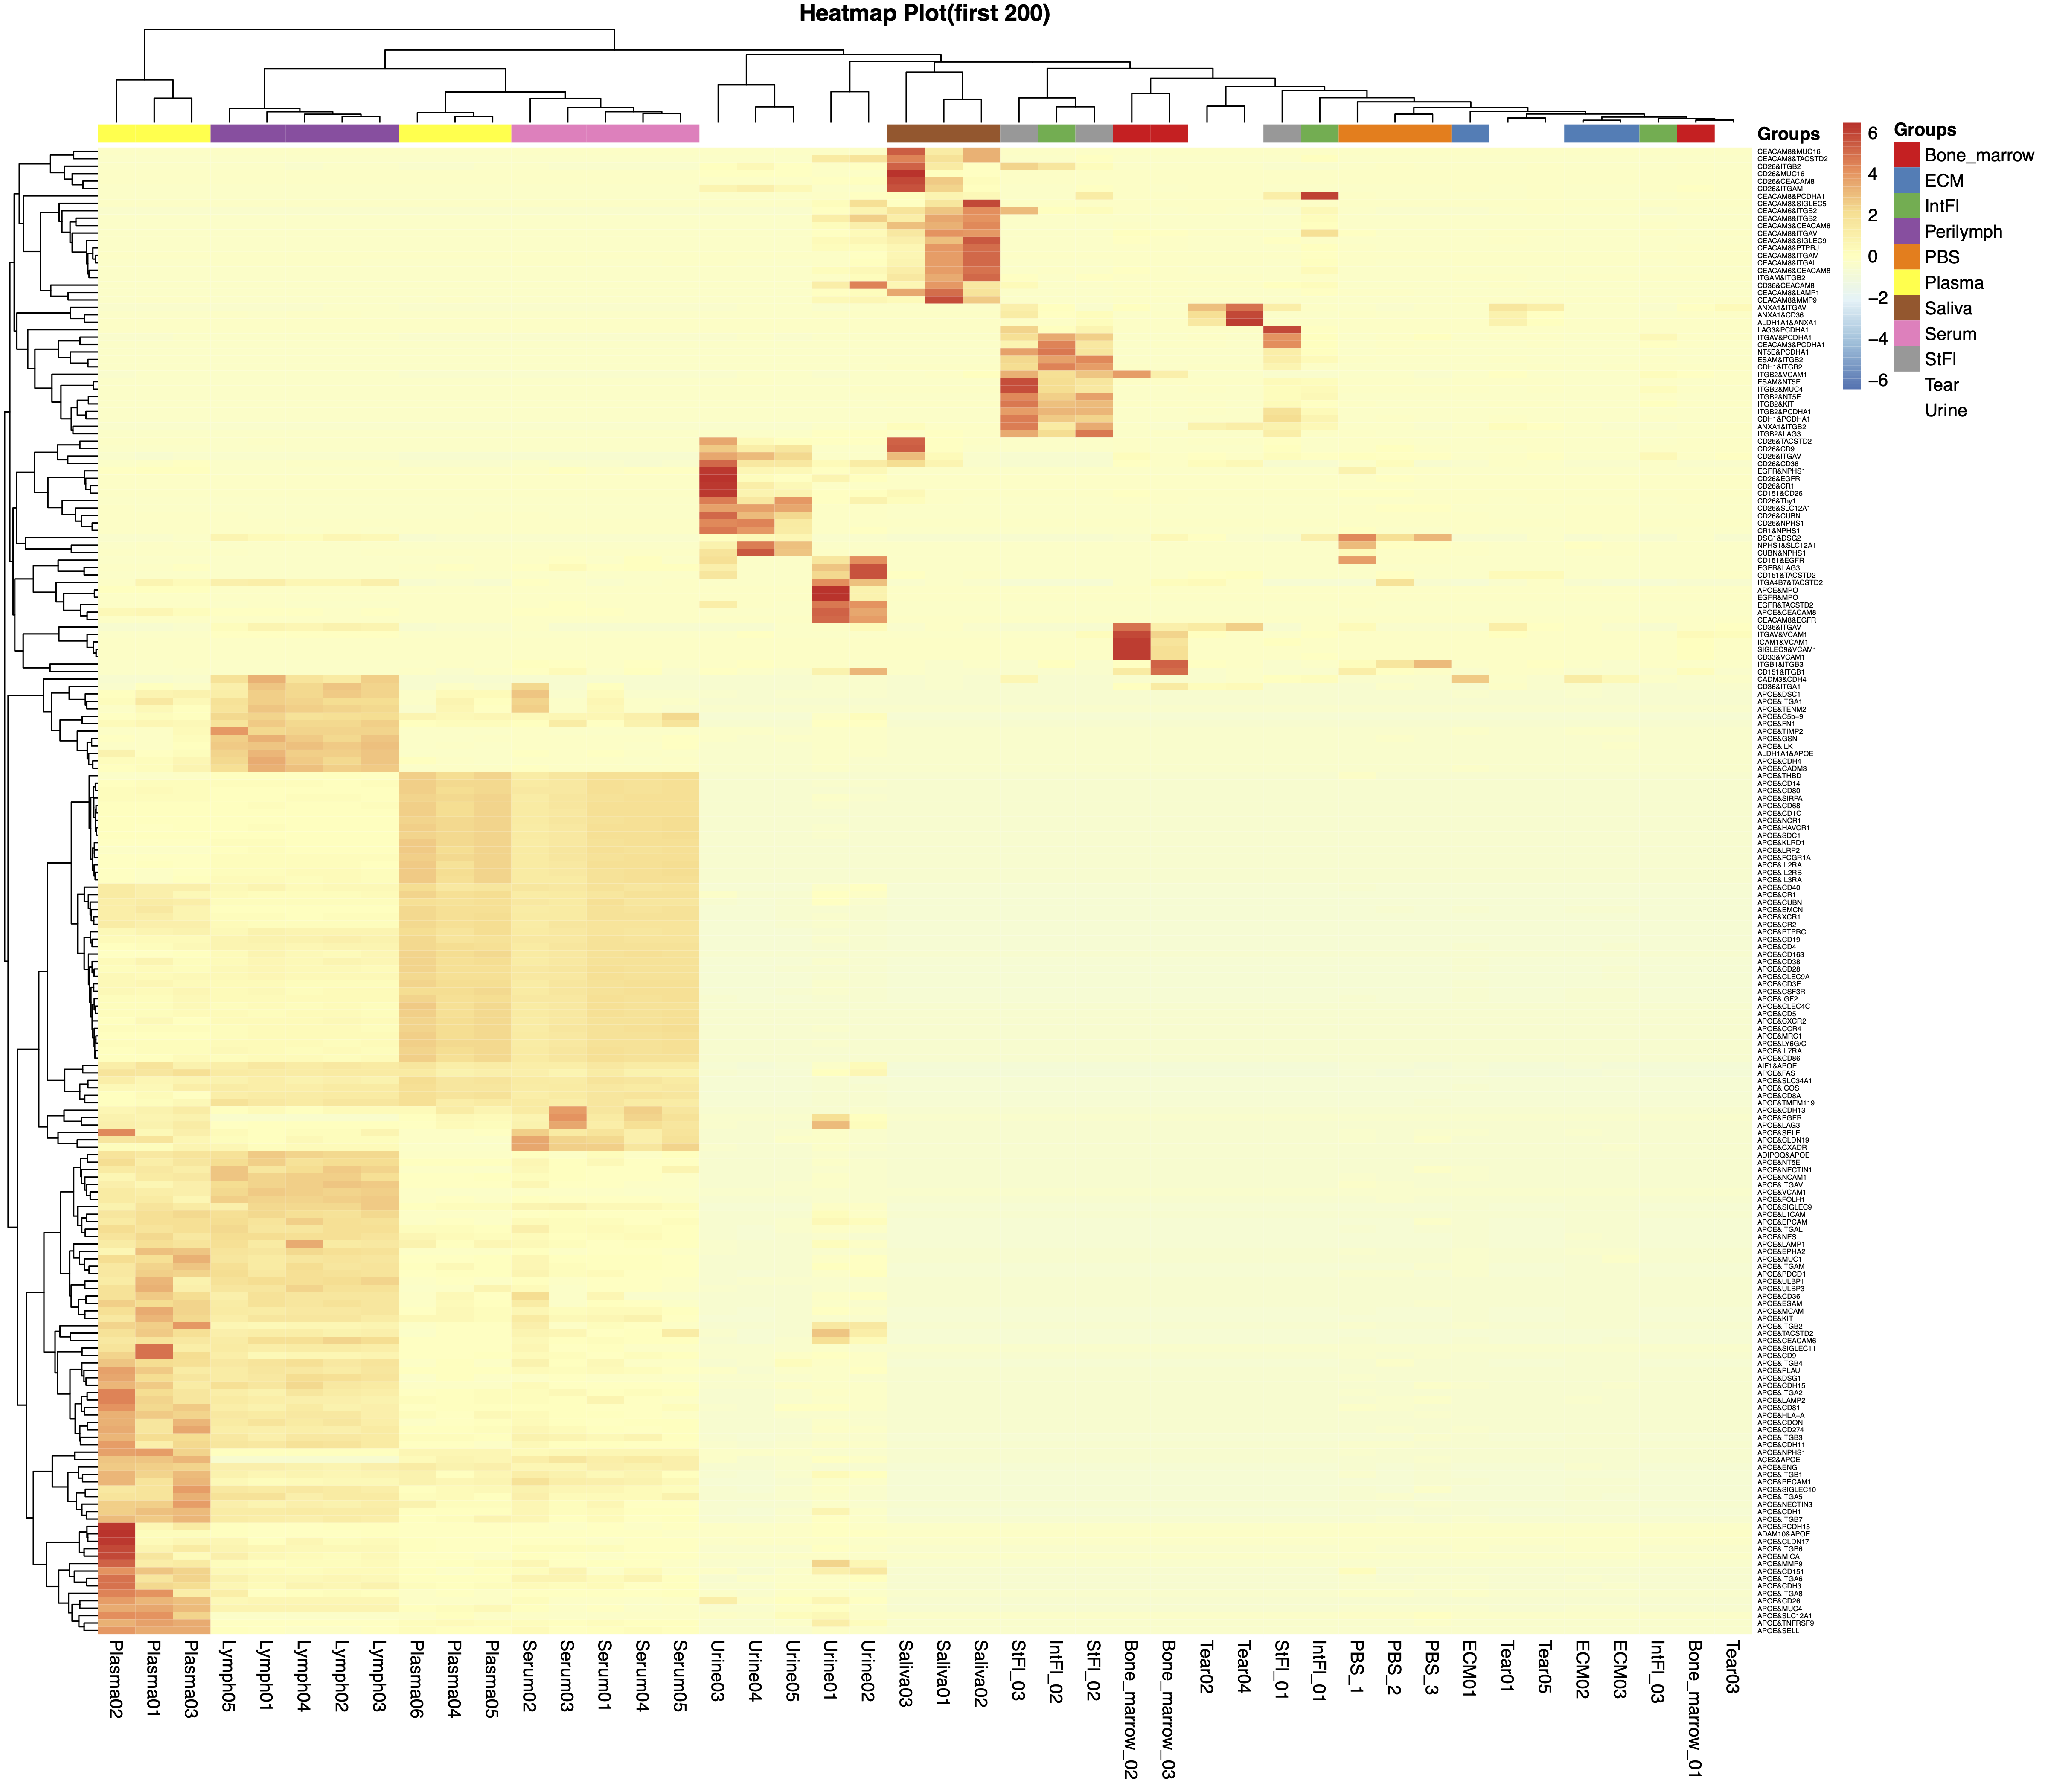
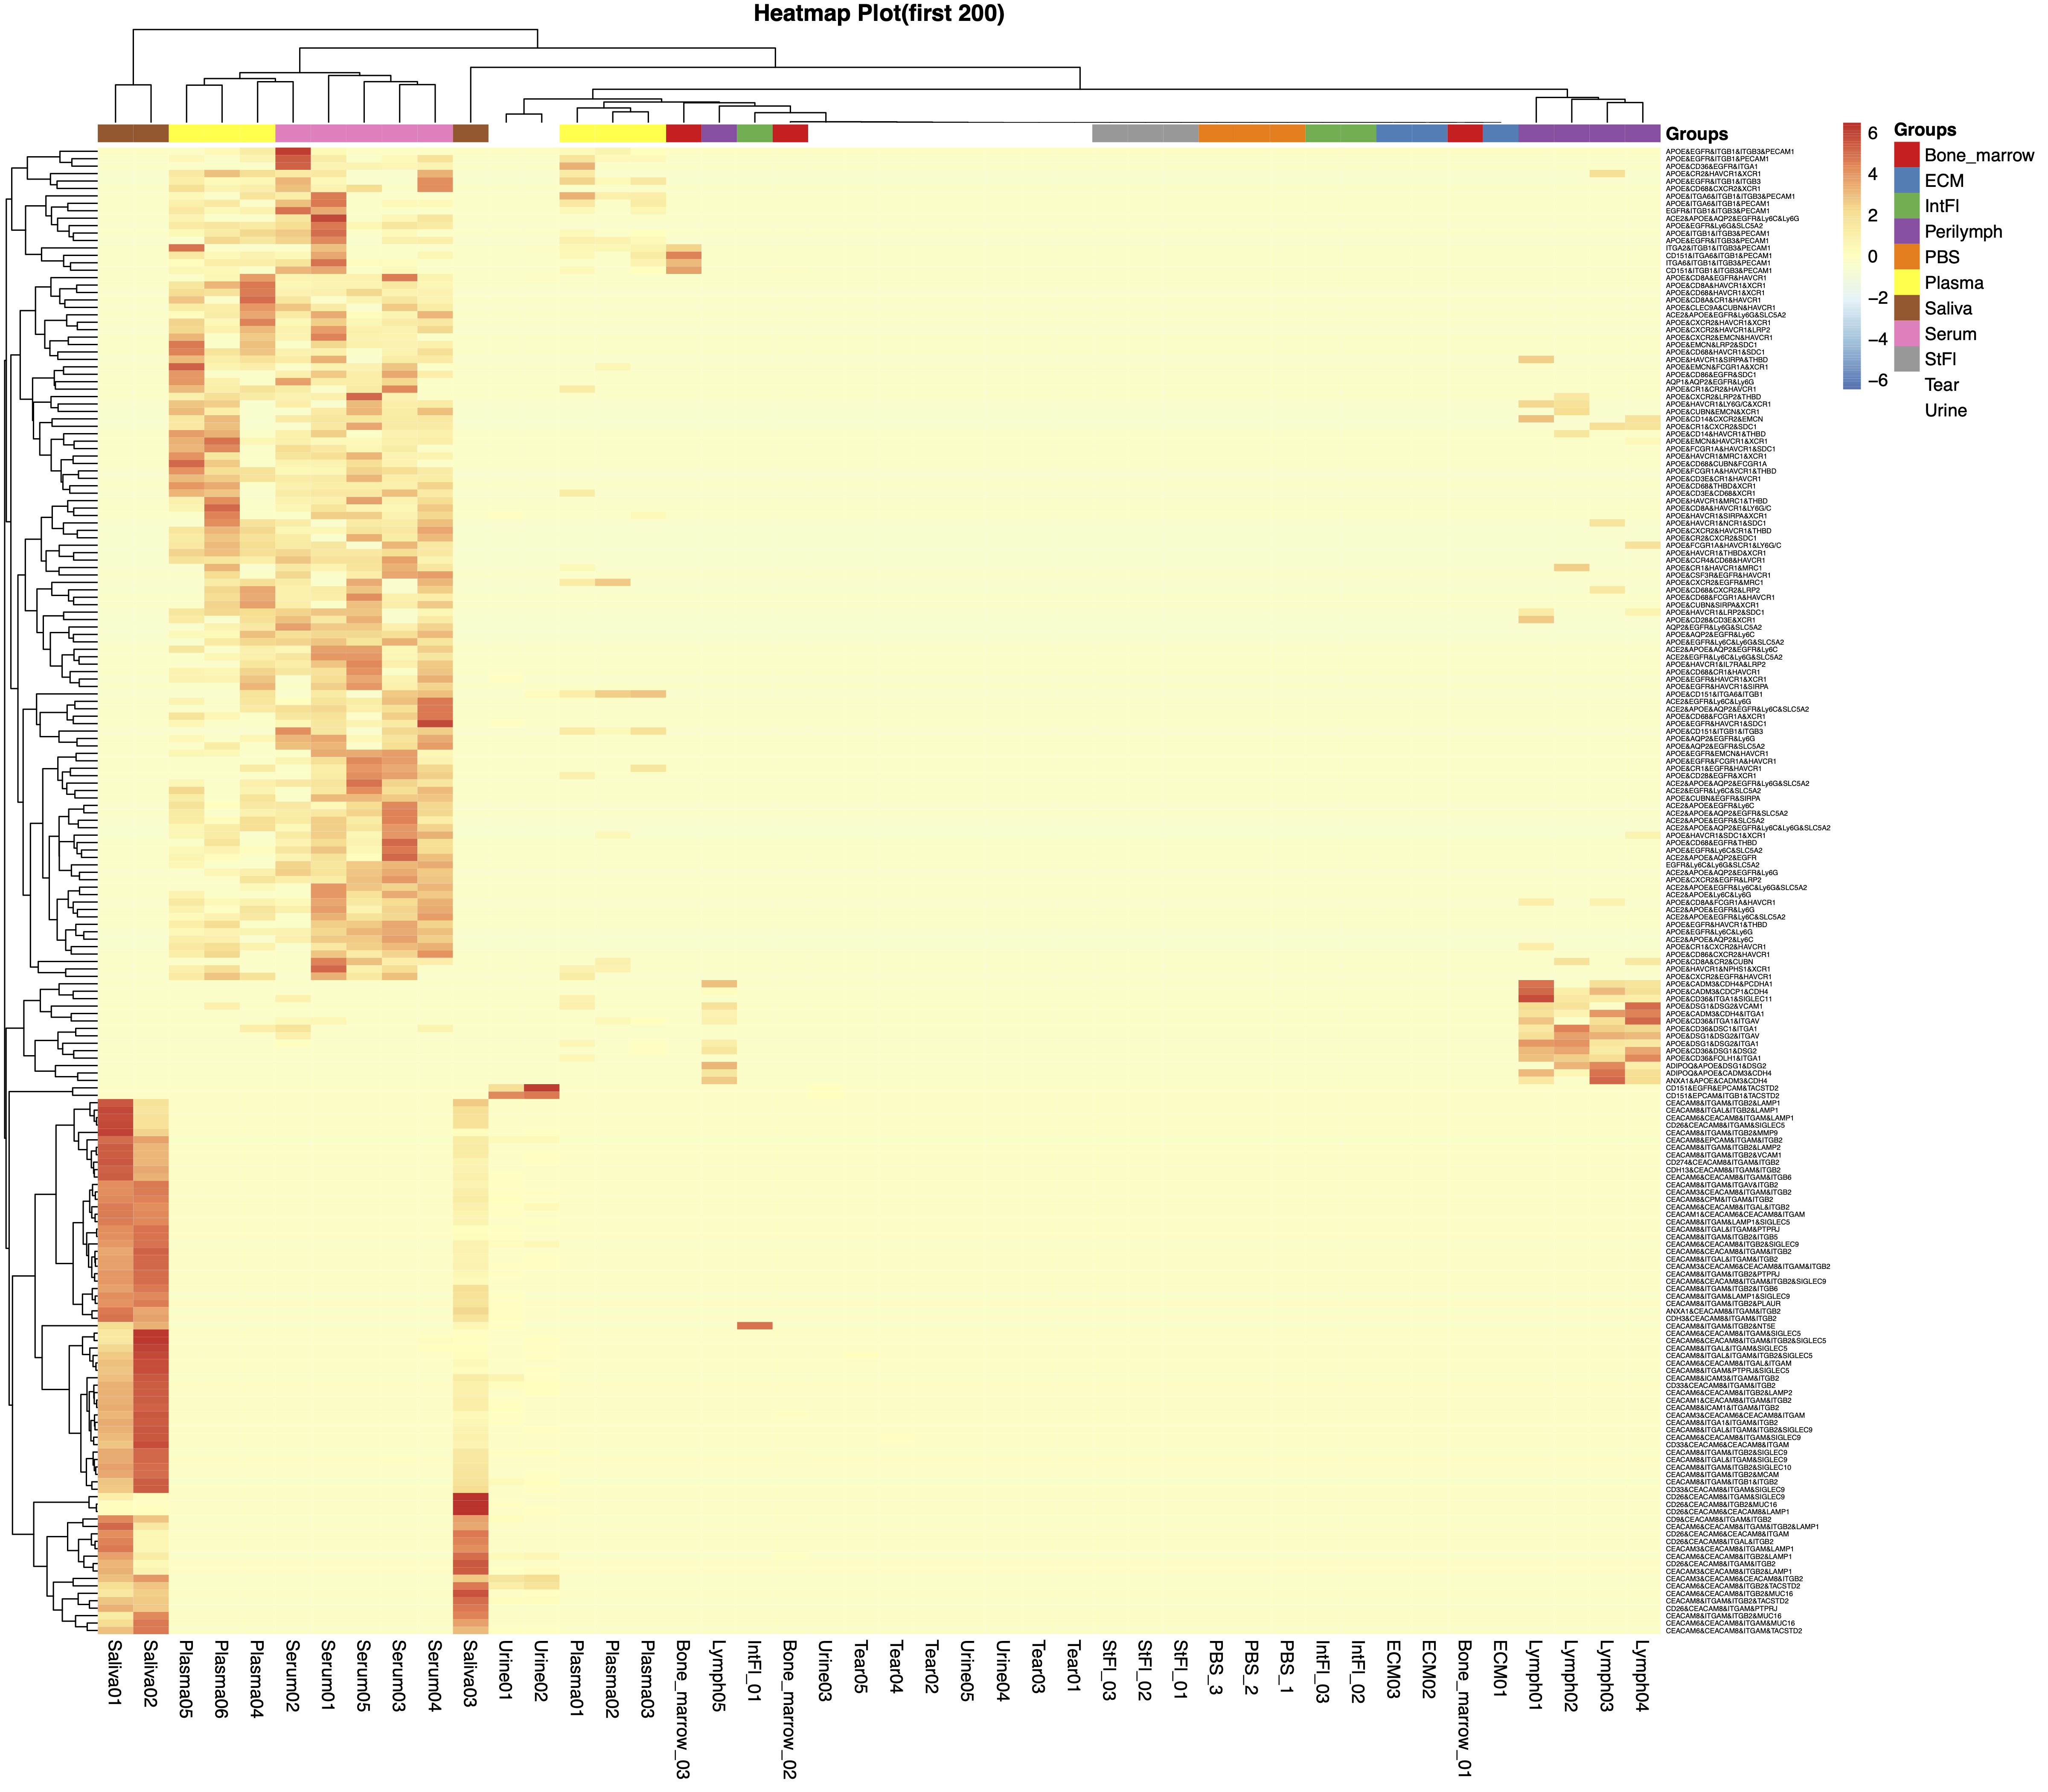
Single-marker approaches in exosome research might exhibit limited specificity for distinguishing EV subpopulations. In this part, we checked multi-marker combinatorial strategies for subpopulation discrimination. Over 300 disease-associated biomarkers were systematically selected, followed by analysis of dual-, triple-, and quadruple-marker combinations.
The heatmaps below illustrate differential expression of these combinations across to show: tissue/organ heterogeneity (45 samples). The horizontal axis represents individual samples or sample groups, while the vertical axis displays the top 100 selected marker combinations. Complete heatmap results are downloadable from the “Download” page
Organ Samples


(A) Dual-marker combination distribution heatmap
(B) Triple-marker combination distribution heatmap
(C) Duadruple-marker combination distribution heatmap
Body-fluid Samples